The application dashboard gives you an easy access to important information and a clear preview of the most crucial statistics.
Go to
DASHBOARD
The application dashboard
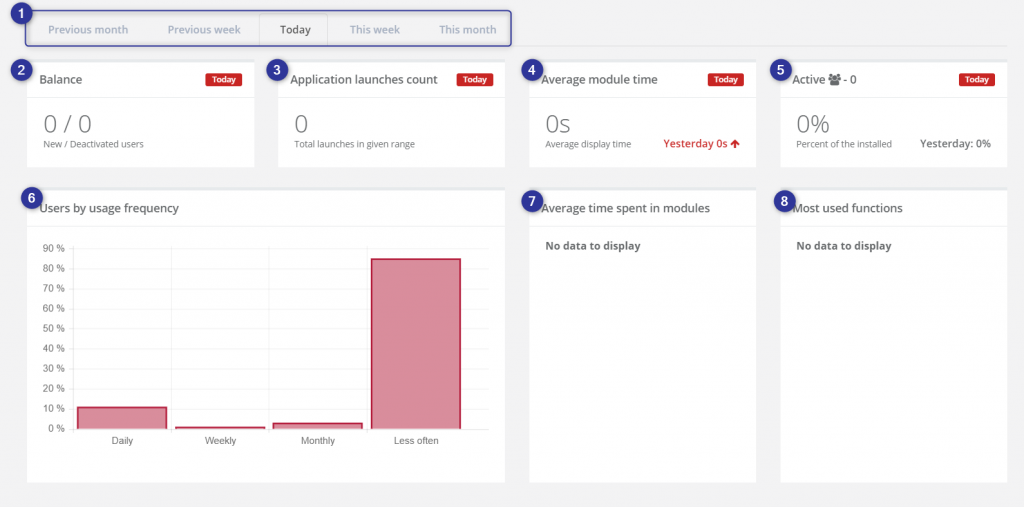
[1] Timeframe – choose the period from which the statistics will be displayed.
[2] Balance – the numbers represent the new and deactivated users. The deactivated users are the people who deleted the application.
[3] Application launches count – it shows how frequently the application is launched.
[4] Average module time – it is the average time spent in a single module of the application.
[5] Active – the percentage of active users in relation to the number of installed applications.
[6] Users by usage frequency – the chart presents the number of users with regard to the frequency of using the monitored application. You can find more information about it here.
[7] Average time spent in modules – it is a graphic representation of the average time of displaying the particular modules. In effect, it will let you distinguish the most frequently used module.
[8] Most used functions – the chart represents the frequency of usage of particular functions. In effect, it will let you distinguish clearly the most frequently used application.