Automation Process Dashboard allows for a complete analysis of the effects of conducted marketing campaigns in one place. Measure the sales generated by all communication channels you use in your campaigns, and see how much of your total sales comes from automation. Based on the data from a detailed analytical panel, make the right decisions, react faster, and improve your campaigns without worrying about achieving your marketing goals.
To open Automation Process Dashboard, go to
Automation Process→ Dashboard → Automation Rules/Workflow
Contents
- Basic information
- Basic data
- Sales analytics
- Top 5 rules/workflows with the highest sales
- Automation Rules
- Top 5 rules with the most activations
- Click sources
- Statistics
- Analytics of selected rules
- Analytics of selected workflows
1. Basic information
Automation Process Dashboard is divided into two parts, in which we can observe changes in sales and changes in the number of clicks in Workflow campaigns and Automation Rules.
Depending on the choice, Dashboards differ slightly from each other, but each of them gives a preview of detailed analytical data. Easily access a list of the best automation and workflow processes and find out what results each one generates. Improve the multi-channel communication process to increase conversion along the customer’s entire shopping cycle.
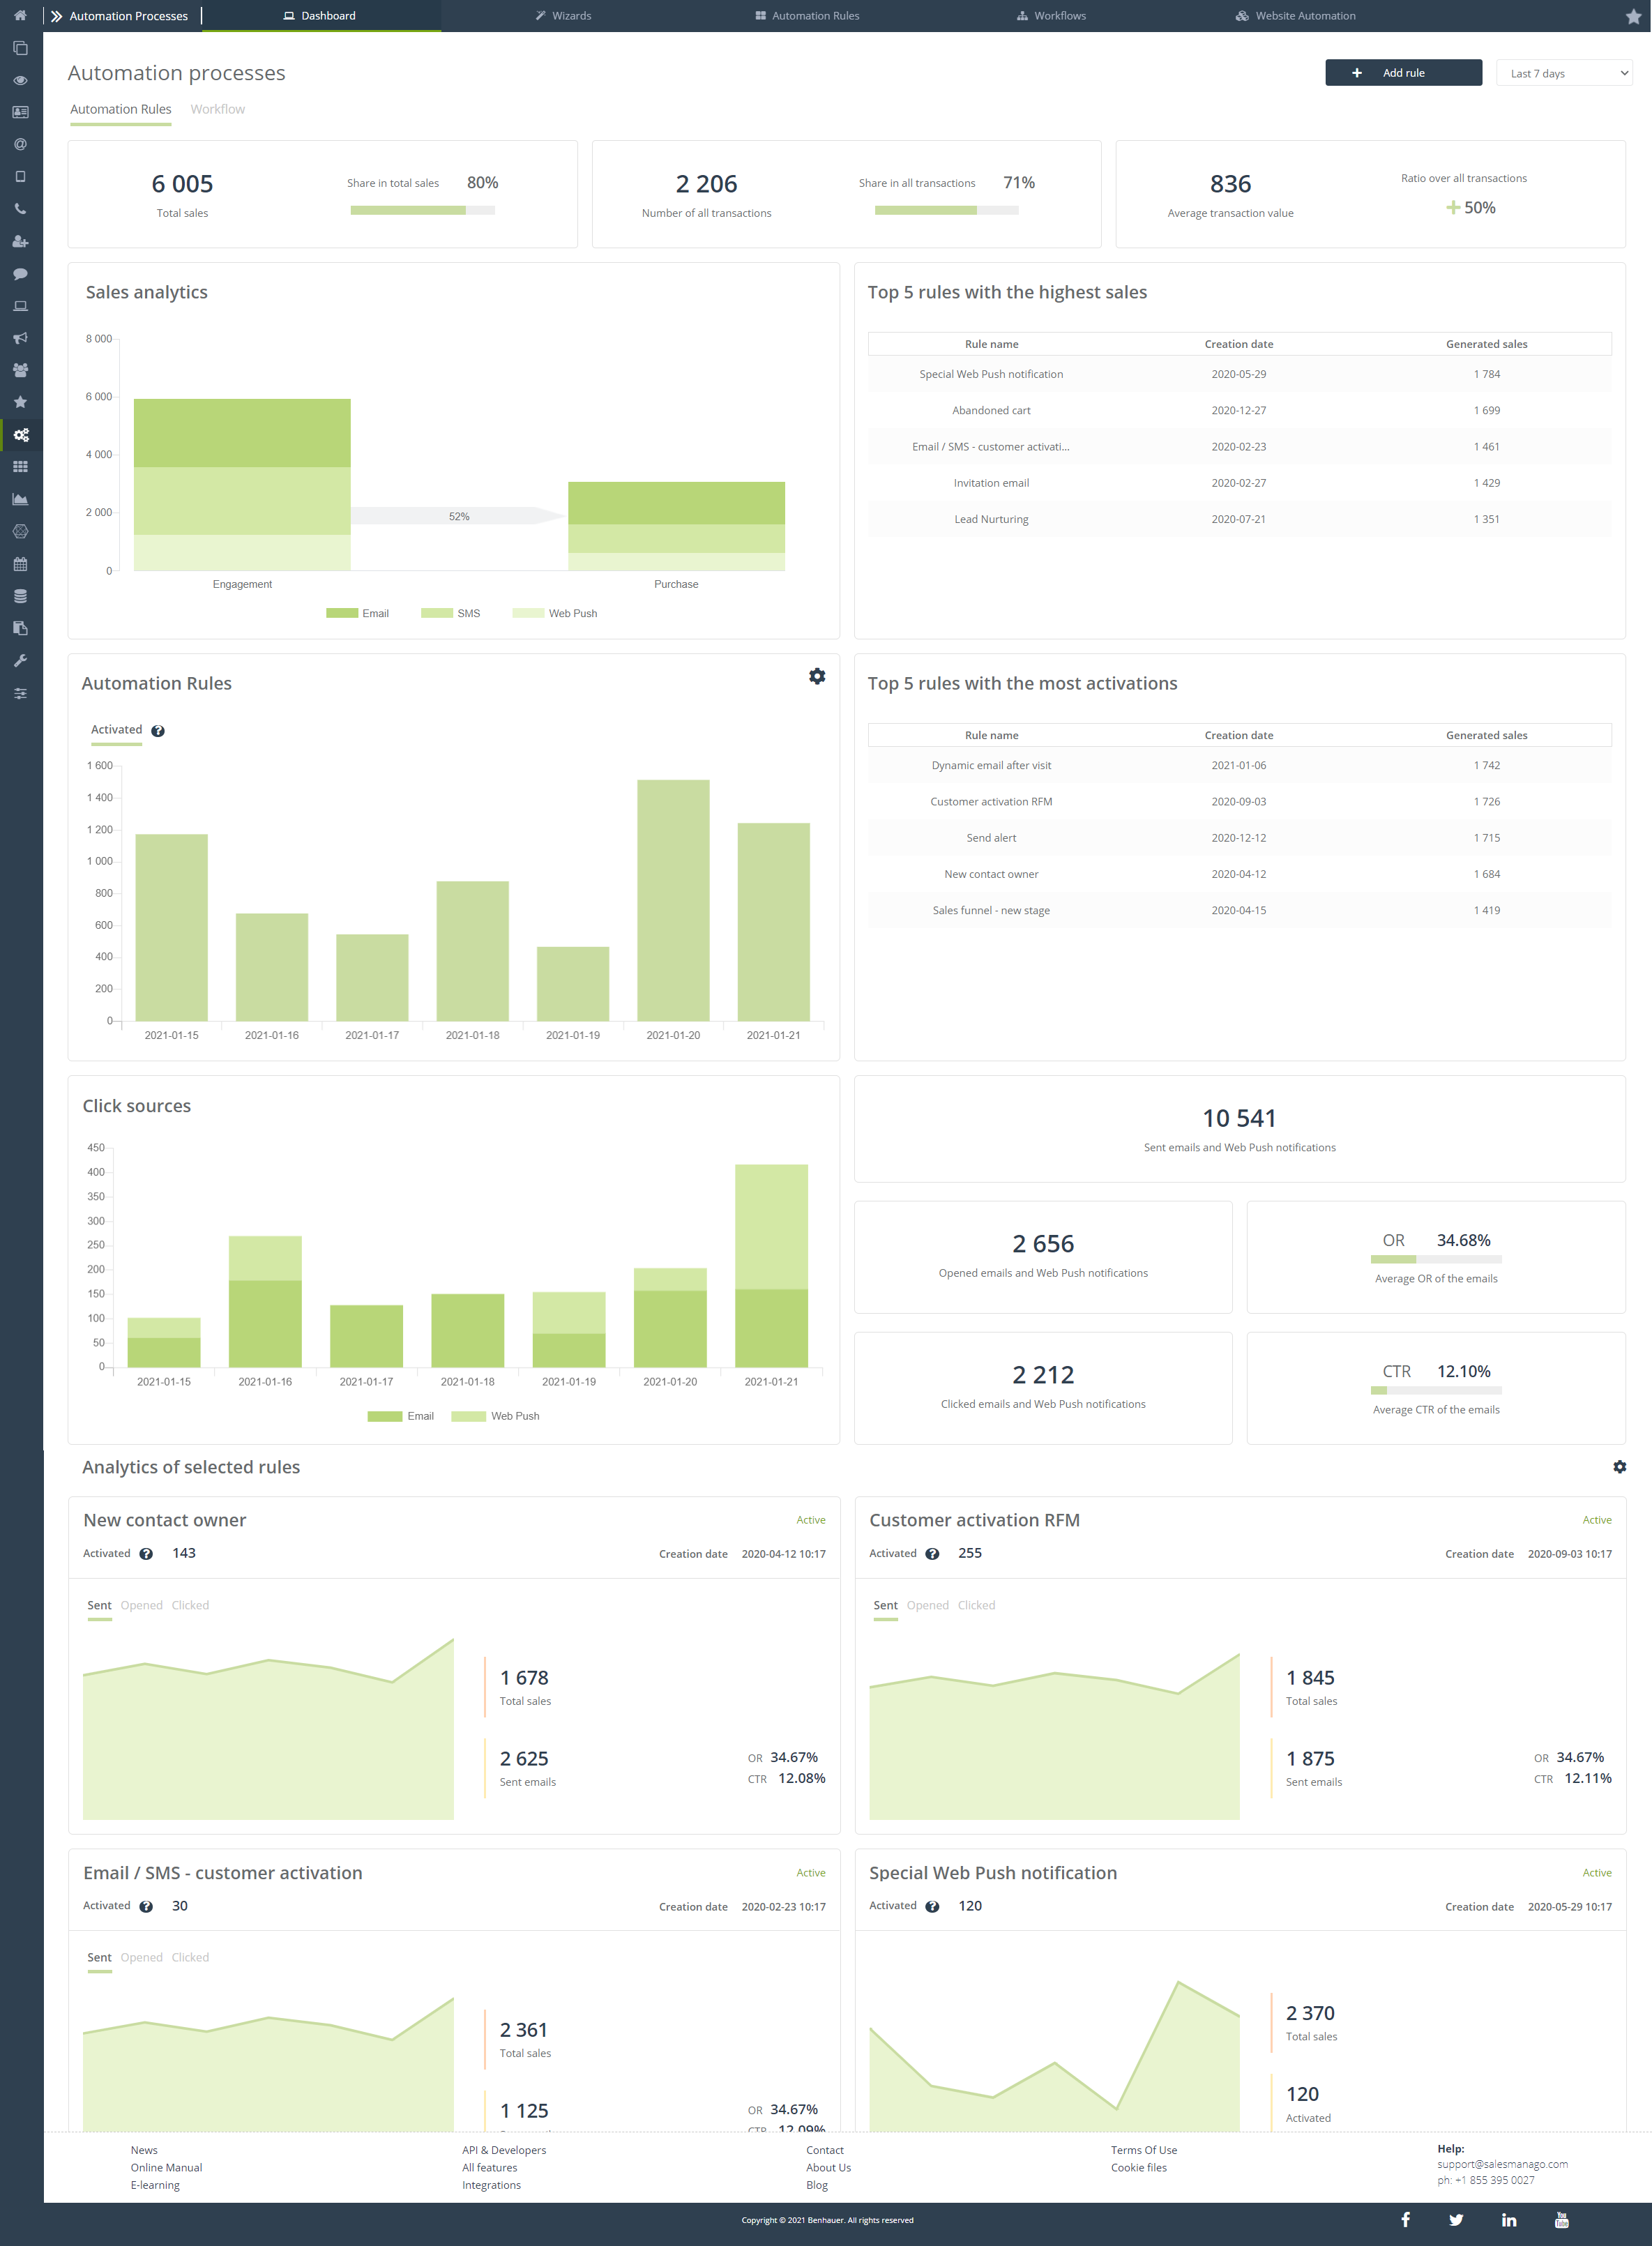
2. Basic data
On the Automation Process Dashboard, you can find basic statistics and information on sales and transactions generated by selected processes.
[1] Add rule/workflow – click to go directly to the wizard of creating a new Automation process.
[2] Time period – select the time period for which there will be displayed information in the tiles below – the available options are last 7 days, 30 days, current month, previous month, current quarter, previous quarter, current year, previous year, last 12 months.
[3] Select data source – choose whether you want to display data for Workflow or Automation Rules on the Dashboard. Depending on your choice, the tiles on the Dashboard may be slightly different.
[4] Total sales – the total amount of transactions of users who took part in the campaigns created in the wizard selected in point [3]. Next to it, there is also Share in total sales, i.e. the percentage of the total number of contacts transactions generated by the functionality from point [3] in relation to the total sum of transactions of all contacts in your contact database.
[5] Number of all transactions – the total number of transactions by users who participated in the campaigns created in the wizard selected in point [3]. Next to it, there is also the Share in all transactions, i.e. the percentage of contacts transactions generated by the functionality from point [3] in relation to the total transactions of all contacts in your contact database.
[6] Average transaction value – the sum of the value of transactions made by users who participated in the campaigns created in the wizard selected in point [3]. Next to it, you can also see the Ratio over all transactions, that is the percentage of the difference in the value of average contacts’ transactions generated by the functionality from point [3], compared to the average of the total sum of transactions of all contacts in your contact database.
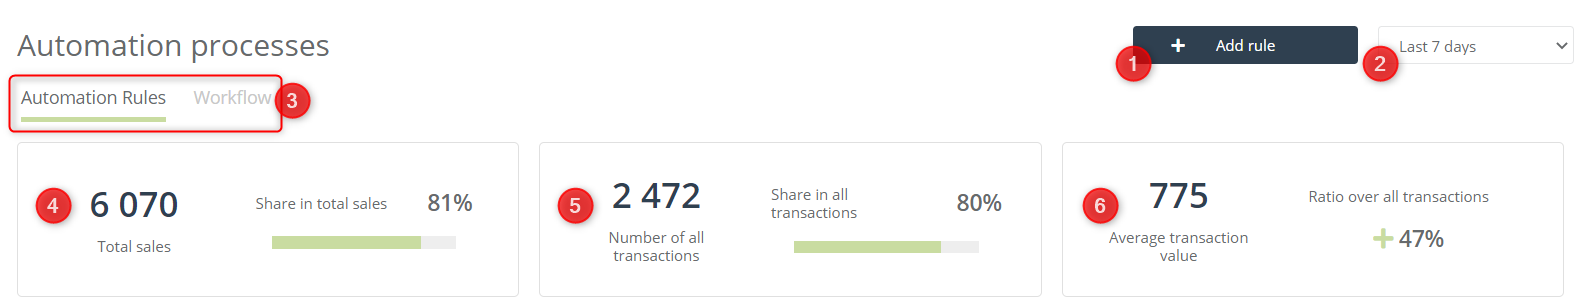
3. Sales analytics
Here you can view the entire sales sum for the selected time period, generated by Workflow or Automation Rules.
On this tile, email, SMS, and Web Pushes are marked with different colors. After hovering the mouse over the Engagement column, we can view the exact number of opened and clicked mailings. The Purchase column shows the exact number of sendings completed with a purchase, taking into account the last source of the buyer’s visit. The Engagement percentage means how many on average shopping visits resulted in the finalization of the transaction.
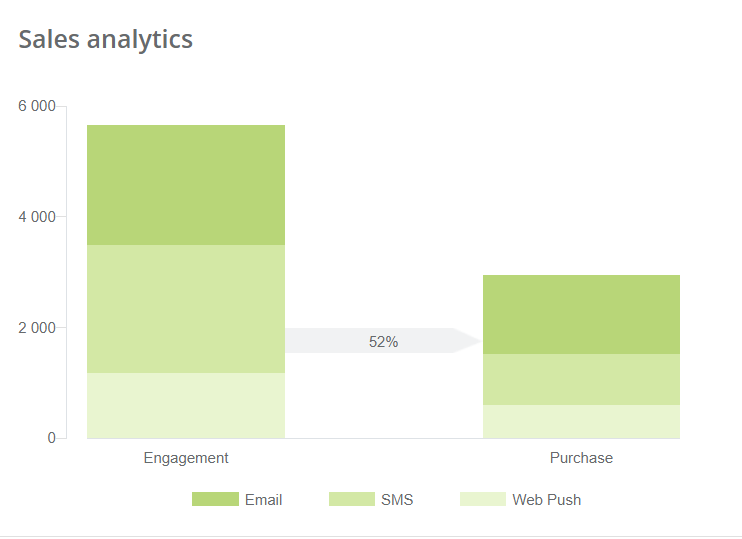
4. Top 5 rules/workflows with the highest sales
The Top 5 rules/workflows with the highest sales list show processes that generate the most profit among all the others.
[1] Rule/workflow name – under this name in the system you will find the given Automation Process to which the remaining data relates.
[2] Creation date – the exact day, month, and year of creation of a given Automation Process in the system.
[3] Generated sales – the total revenue from a given Automation Process, i.e. the total sales of the process.
5. Automation Rules
This tile is only available for the Automation Rules Dashboard.

The graph shows the dependence of the number of activated rules over time, where one activation is one rule started by the user by triggering a specific event.
IMPORTANT: By clicking the settings button, you can freely change the display of the chart to a line or bar.
6. Top 5 rules with the most activations
This tile is only available for the Automation Rules Dashboard. Provides a list of the five rules with the highest number of activations, meaning the greatest number of users started the given rule by triggering a specific event.

[1] Rule name – under this name in the system you will find a given Automation Process to which the remaining data relates.
[2] Creation date – exact day, month, and year of creation of a given Automation Process in the system.
[3] Generated sales – the total revenue from a given Automation Process, i.e. the total sales of the process.
7. Click sources
The tile shows a columnar listing of the number of clicks and their sources. depending on the Automation Process, different communication channel statistics are available.
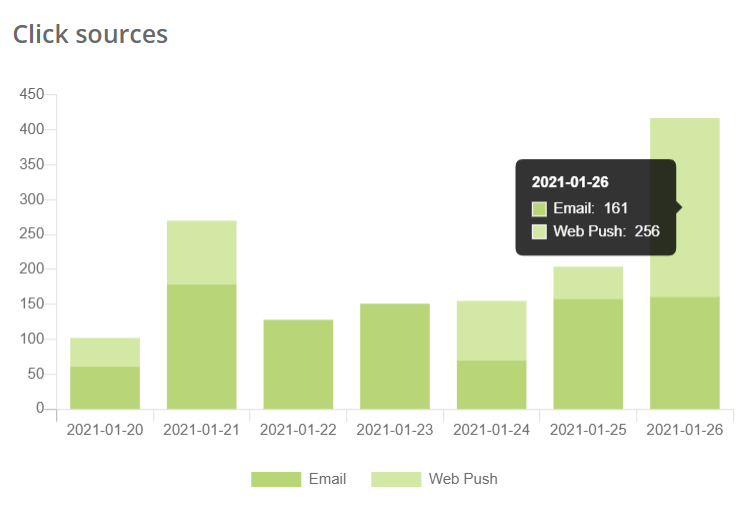
For Automation Rules, click statistics from email messages and Web Push notifications are visible, while for Workflow statistics only from email messages are available.
8. Statistics
Statistics for Workflow and Automation Rules are available here. Depending on the type of process, they differ slightly from each other.
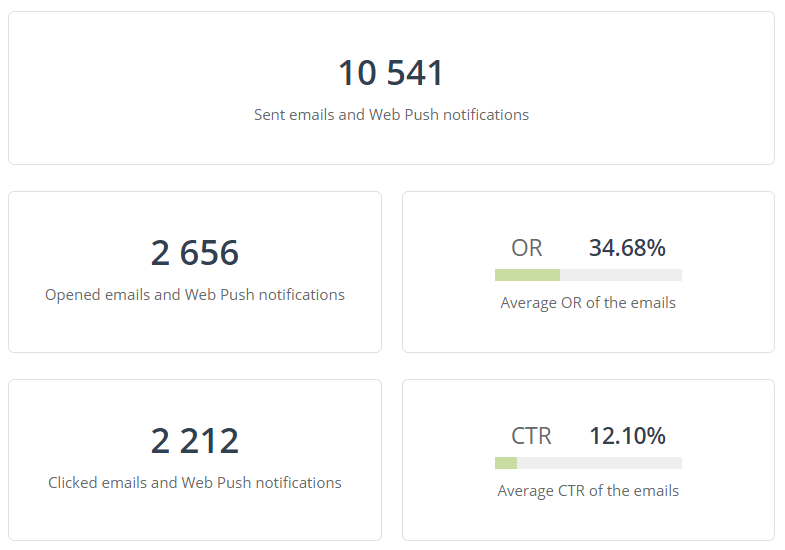
As for the rules, as in the click sources, statistics are available for email messages and Web Push notifications, while in the Workflow statistics only email messages are available.
The Average OR of the emails tile shows the Open Rate percentage, which shows the ratio of the number of emails opened by recipients to the total number of emails sent
The Average CTR of the emails tile shows the Click Through Rate percentage, which shows the ratio of the number of emails clicked by recipients to the total number of opened messages.
9. Analytics of selected rules
Selected rule analytics presents the most important information about each selected rule. In the Settings window, you can choose any Automation Rule for which statistics you want to display. The data on the tiles may slightly differ, depending on what actions are performed within the given rule.

[1] Rule name – under this name in the system you will find the given Automation Process to which the remaining data relates.
[2] Status – informs whether the given process is active or inactive in the system, i.e. whether triggering the event it covers will trigger the given actions.
[3] Activated – the total number of starts of a given process, taking into account the number of times a specific event is triggered by the process.
[4] Creation date – the exact time of creating a given Automation Process in the system.
[5] Graph – choose from the available options (Sent, Opened, Clicked) the information for which the statistics will be presented on the graphical graph.
[6] Total sales – the total amount of revenues from purchases made using a given Automation Process.
[7] Sent messages – total number of messages sent for a given process and OR and CTR ratios for them.
IMPORTANT: Sent emails element appears on the tiles alternately with the number of activations, depending on whether the process includes sending e-mails.
10. Analytics of selected workflows
Selected workflow analytics presents the most important information about each selected workflow. In the Settings window, you can select any process for which you want to display statistics. The data on the tiles may slightly differ, depending on what actions are performed within a given Workflow.
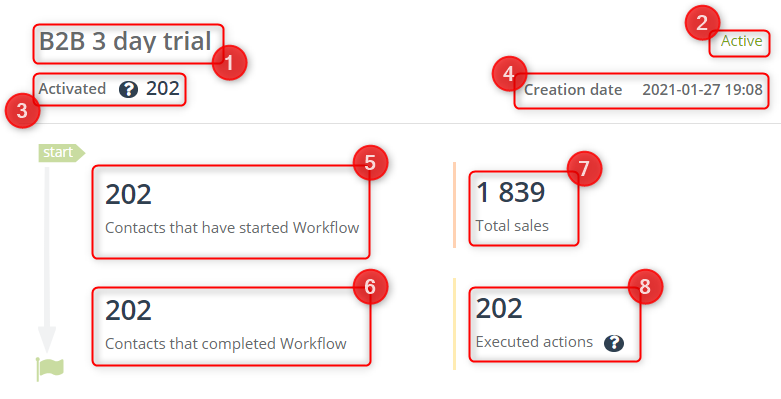
[1] Workflow name – under this name in the system you will find the given Automation Process to which other data relates.
[2] Status – informs whether the given process is active or inactive in the system, i.e. whether triggering the event it covers will trigger the given actions.
[3] Activated – the total number of starts of a given process, taking into account the number of calls to a specific event that starts the process.
[4] Creation date – the exact time of creating a given Automation Process in the system.
[5] Start – the total number of contacts who started the Workflow but haven’t finished it yet.
[6] Completed – the total number of contacts that started and completed the Workflow.
[7] Total sales – the total amount of revenues from purchases made using a given Automation Process.
[8] Executed actions – the total number of action tiles that have been executed in a given Automation Process.
IMPORTANT: The Executed actions element appears on the tiles alternately with the Sent emails element, informing about the number of emails sent and their average OR and CTR ratio, depending on whether the process includes email sending or only actions performed.