Business dashboards are the analytical panels which enable your own configuration of the dataset. You can decide what kind of statistics you want to see once you log into the system. This way all parameters received through the ongoing campaigns become measurable, and what’s more, they can be analyzed and the activities optimized. Two sets of editable dashboards have been pre-prepared which show the data concerning the marketing and sales activities.
The possibility of creating your own dashboards, which content and the layout can be adjusted to your own preferences, is another step to effective and comfortable management. All information about transactional data, the current state of contact base and email analytics is within reach.
Benefits:
- rich widget collection,
- over 1000 variations of data to configure,
- advanced chart settings – a possibility of choosing the chart type (bar or line chart),
- new time frames in the charts,
- wide choice of widgets displaying advanced transactional data (detailed analysis of transactions, abandoned carts and the analysis of correlations between traffic website and the number of transactions),
- wide choice of widgets from the contact analytics category,
- wide choice of widgets from email marketing category,
- the option of adjusting the color scheme and names of the widgets,
In order to personalize your own dashboard go to
START
Contents
- Adding a new dashboard
- Widget library
- Editing widgets on the dashboard
a) adjusting the size of the widget
b) choosing a place for the widgets on the dashboard - Widget settings
- Exemplary widgets
- Permissions
1. Adding a new dashboard

To add your own dashboard, click the button ![]() . Then a pop-up displays with a request to enter the name for the new dashboard. The name identifies the dashboard, so you can find it later on the upper ribbon [1].
. Then a pop-up displays with a request to enter the name for the new dashboard. The name identifies the dashboard, so you can find it later on the upper ribbon [1].
[1] – it’s the place where you can find all dashboards that have been created in the system. There are two predefined dashboards: marketing and sales dashboards. You can create up to 5 personalized dashboards.
[2] Edit – each created dashboard can be edited at any time.
[3] – the button that adds a new dashboard.
If you hover the cursor over the dashboard name, you will see the three following icons: ![]() .
.
![]() – click the button and move the dashboard onto the chosen space on the panel with dashboards.
– click the button and move the dashboard onto the chosen space on the panel with dashboards.
![]() – click the button to change the dashboard name.
– click the button to change the dashboard name.
![]() – the option of removing the dashboard.
– the option of removing the dashboard.
2. Widget library

A widget library is a place in which you can find all widgets that you can add to your dashboard. Widgets are the editable elements that present on the dashboard particular pieces of data in the form of numbers or charts. All widgets are divided into three groups and the frequency of data update of the widgets is dependant on the group to which the widget belongs.
You can find more information about the widget library here.
[1] The widget groups
- Contacts – this group contains the charts and pieces of information concerning the contact base state, the contact growth, etc. Data is updated in this group once a day.
- Email marketing – this group consists of the widgets concerned with information about the number of sent messages, OR, CTR, etc. The data inside this group updates every 15 minutes. In the next group
- Web push – the group of widgets presenting information concerning consent forms and web push notifications, including OR, CTR. Among them, you can find information about the number of views, clicks in Web Pushes and consent forms in the given time range and also the comparison of those results.
- Sales analytics – contains the widgets presenting various data, such as total sales, the number of all transactions, total sales of carts and also transactions and page views.
- Revenue attribution analytics – the group of widgets presenting various data on total sales and also the number of transactions, considering the source of even occurrence.
- Product analytics – contains widgets presenting data on the most popular categories, the most popular products, the most popular producers and brands in terms of the quantity of sold products.
IMPORTANT: Data in widgets that you have in Products Analytics and Revenue Attribution Analytics base on information sent in external events, type: purchase.
When you choose the group of widgets, their frames will be highlighted with green color. Click them to select and double-click it to cancel your choice.
[2] Add chosen widgets – click the button to add the widgets you selected to the dashboard.
IMPORTANT: One dashboard can consist of up to 24 widgets.
[3] Templates – choosing this feature, you can use already prepared sets of selected widgets.
3. Editing widgets on the dashboard
[A] Adjusting the size of the widget
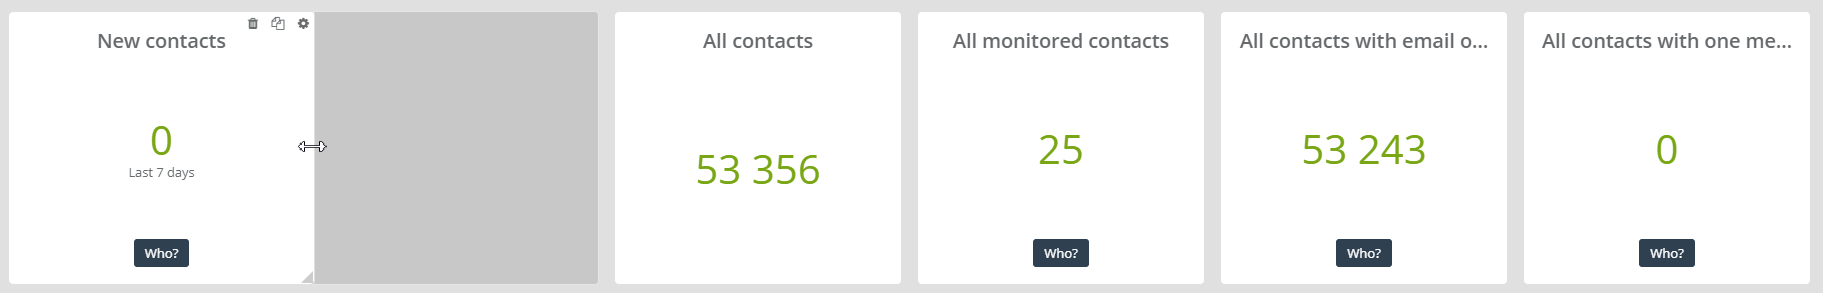
Adjust the size of the widget by hovering the cursor over the edge of the widget. The maximum size the widget can take is highlighted grey color. You can add widgets in three rows and each row can contain up to 6 widgets (6×3).
[B] Choosing a place for the widgets on the dashboard

Drag and drop the widget onto the chosen place.
IMPORTANT: To add a widget into a chosen place, you need to prepare a space for it.
4. Widget editing
Hover the cursor over the widget and you will see three icons in the upper right corner ![]() .
.
![]() – the option of removing the widget.
– the option of removing the widget.
![]() – the option of duplicating the widget.
– the option of duplicating the widget.
![]() – settings of the widget.
– settings of the widget.

[1] Time frame – data in the widget will concern the selected period. Choose it from the dropdown list or specify the time period in the calendar.
[2] Owner – this option appears in the widget concerned with the Contacts group. Then you need to specify the contact owner (that is the email address of the owner) to which the contacts are assigned. So the numbers presented in the widgets will concern only the contacts who belong to the owner.
[3] Additional settings – tick the option if you want to change the colors of the widget.
[4] Name – type in the name of the widget in the text field that will display in the headline of the widget.
[5] Widget color – choose the color scheme of the widgets that match your preferences.
[6] Default widget name – this is the original name of the widget given.
5. Exemplary widgets
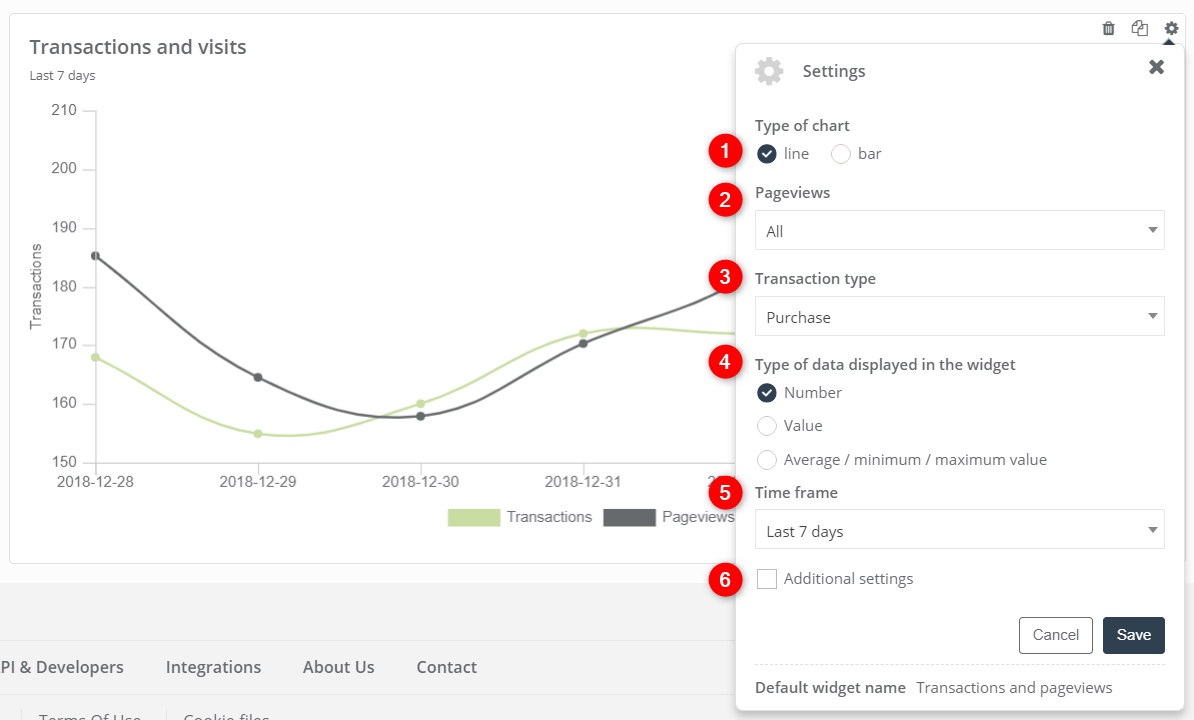
[A] Transactions with visits – this widget lets you analyze the relationship between the website traffic and transactions.
[1] Type of the chart – choose the form in which the data in the chart will be displayed, it can be either on a bar chart or a line chart.
[2] Pageviews – choose the type of visits that will be reflected on the chart: monitored, anonymous or all.
[3] Transaction type – choose the kind of transactions that will be correlated with the statistics on the website traffic. You can choose abandoned carts or purchases.
[4] Type of data displayed in the widget – choose the kind of transactional data that will be displayed in the chart. You can compare the website traffic with the number of transactions or (maximum, minimum or average) value of transactions.
[5] Timeframe – data in the widget will concern the selected period. Choose it from the dropdown list.
[6] Additional settings – tick the option if you want to change the colors of the widget.
[B] Average / minimum / maximum value of abandoned carts – this widget lets you analyse the chosen value of abandoned carts.
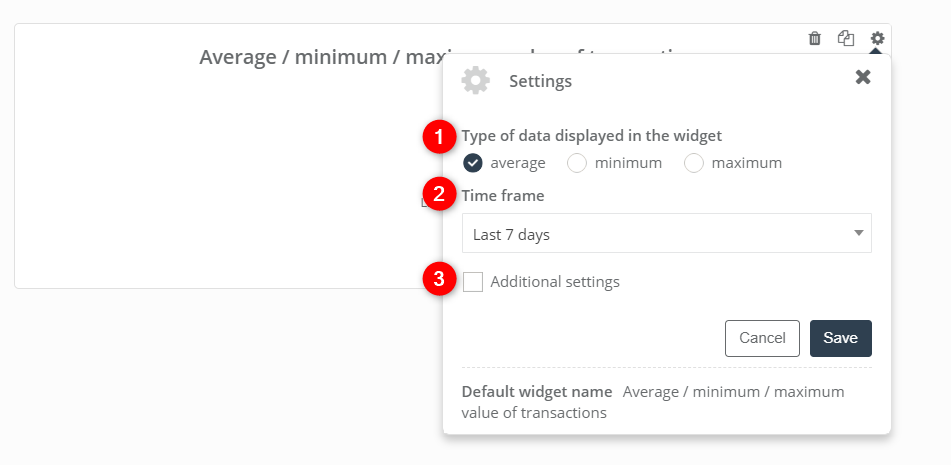
[1] Type of data displayed in the widget – choose displayed value of the abandoned carts
[2] Timeframe – data in the widget will concern the selected period. Choose it from the dropdown list.
[3] Additional settings – tick the option if you want to change the colors of the widget.
6. Permissions
Now you can change and give permissions in your business dashboards and decide who has access to them.
In order to change permissions, in the main menu on the left click Settings and next Users on the uppon ribbon. Here you can see the list of all system users. Click Edit in order to change settings for a particular user.
1. Account settings

[1] – here you have information as follows:
-
- Name
- Surname
- Email – this is email address used to login to the system. Alerts and reports are sent there.
IMPORTANT: One email address can be assigned to one account user only. If an account user is deleted, an email address cannot be used again.
- Phone
- Password – it is used to login to the system. It can be changed at any time.
- Confirm password – fill in with the password again
[2] Choose an image – here you can add a graphic element
[3] Next, Cancel – click Next to continue or Cancel to go back to the list of users
2. Permissions
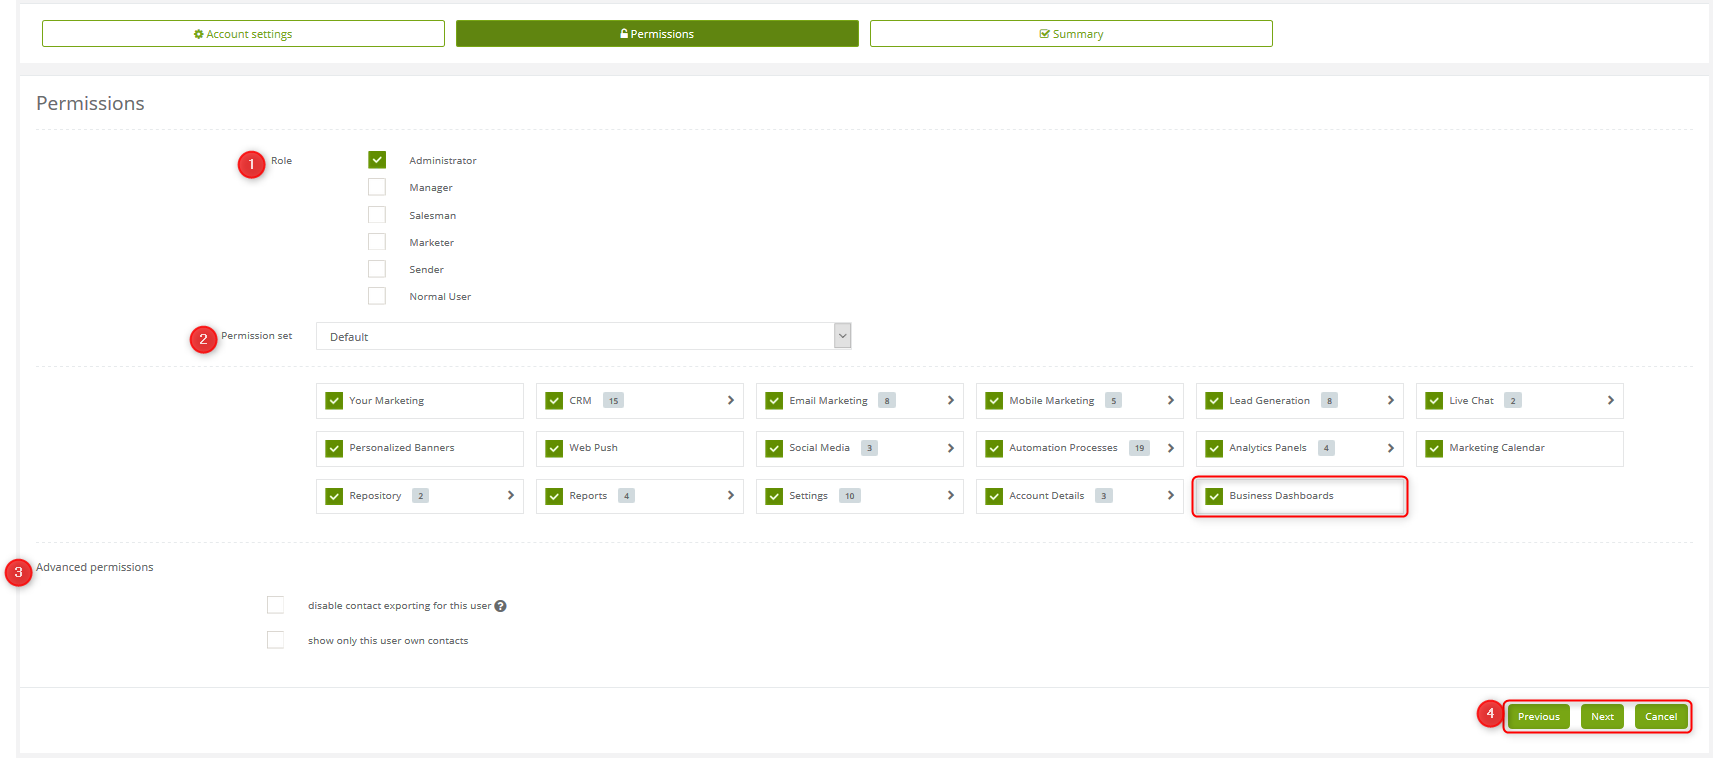
[1] Role – select one of the following roles: administrator, manager, salesman, marketer, sender, normal user. Remember that each role has a default set of permissions which you can modify.
[2] Permission set – select Default to have permission set assigned to the role or other option available on the drop-down list
Below you can mar/unmark selected features and decide which ones are visible for the users. Among the features you can find Business dashboards.
[3] Advanced permissions – here you can disable contact exporting for the user (first checkbox) and/or show only contacts that the user owns (second checkbox).
[4] Previous, Next, Cancel – you can go to the previous step (Previous), go to the next step (Next) and go back to the list of users (CanceL).