SALESmanago Copernicus – Machine Learning & AI is an advanced self-learning algorithm that analyzes the behavior of individual customers, predicts future purchases. It provides insight into customer purchase history, buyer’s journey, and analyzes the way products correlate in categories, allowing for highly engaging and eye-catching offers to be delivered to individual customers at the right time. The feature is equipped with the comprehensive analytical panel that guarantees the access to both general information such as the degree of the contact base coverage with the product recommendations and to the detailed information as well. Among the advanced statistics, you can find the charts that present the connections between products and categories, the list of top 10 categories that gain the highest interest of customers and also the charts presenting the correlations of recommended products in the most popular categories. Additionally, the panel lets you choose a product or category to which the system prepares similar products which recommendation power between products and the main product is the highest.
Preparation
Before you can use AI Recommendations, make sure you have sufficient data to analyze in SALESmanago. You will need three sets of data. One is transaction data – external events of the “purchase” type. The other is your .xml file – create one and upload it to SALESmanago if you haven’t done it already. The third set is: data concerning visits on the website.
If you don’t have enough transaction data yet, you can import historical transaction data from your e-commerce platform to SALESmanago. If you need help with importing historical transaction data, your personal system assistant will be happy to help.
>>Learn how to upload an XML file to the system
>>Learn how to prepare an XML file correctly and how it can be used
Implementation
When transaction data and the XML file are ready, get in touch with your Project Manager (or support@salesmanago.com), who will arrange the implementation the AI Recommendations with the IT department on your account. This process takes from 3 to 7 days to properly configure and prepare the mechanism of intelligent recommendations.
After this is done, the recommendation module is ready – it will begin updating recommendations for customers who already have made a purchase.
Analyzing output data
The mechanism of SALESmanago Copernicus – Machine Learning & AI works on the basis of recommendation types that match the products co-occurring in specific circumstances:
- Collaborative filtering – this type of recommendation involves two approaches. The first one called Product-Product is connected with probability and frequency of co-occurrence of different products (not necessarily similar to each other). The second approach is called User-Product approach and it shows which products may interest a user based on the interests of other users who have a similar profile to the chosen one. Generally speaking, the idea behind this type of AI recommendation is to offer products based on the similarity of users and concurrence of various products.
- Most frequently bought after visit other – based on which product the customer is currently displaying on the website, the system analyzes purchases of other customers who also displayed this product and recommends the products purchased by other users to the user.
- Most frequently visited together – As the name suggests these are the products that are often viewed together by all users. The system offers products which were browsed by other users along with these products.
- Most frequently bought together – The system analyzes the products the customer has purchased. And also the system analyzes the products which have been purchased by other users along with the same products.
- Mixed statistics with weight – The mechanism behind this recommendation type employs all previously enlisted types of recommendations and additionally assigns a weight for each action. The value of the weight can be determined by you. How does it translate into practice? The system creates connections and analyses products bought by the contact, recommending in the first place several products which are probable to be bought, then products which the user wants to see and so on and so forth prioritizing the rest of the products with regard to the actions.
Benefits:
- Find out which products and categories are the most successful
- Learn about your customers’ individual preferences and predict their next purchase
- Streamline your marketing budget
- Achieve the maximum customer lifetime value in each case
Go to Insights → Artificial Intelligence → AI Recommendations
Contents
- AI Recommendations
- Graph of relations between categories and products
- Top 10 recommended categories and ratio of recommended products
- Recommendations selected on the basis of the chosen product
- Recommendation selected on the basis of the chosen category
-
AI Recommendations
In the first step choose the e-shop [1] so the statistics can be generated to the e-shop in which AI & Machine Learning module has been implemented. Then, choose the recommendation type [2] to which statistics will be generated. There are 5 types of recommendations and each of the type has two charts that present the coverage of recommendations available in the database for users and products.
2. Graph of relations between categories and products
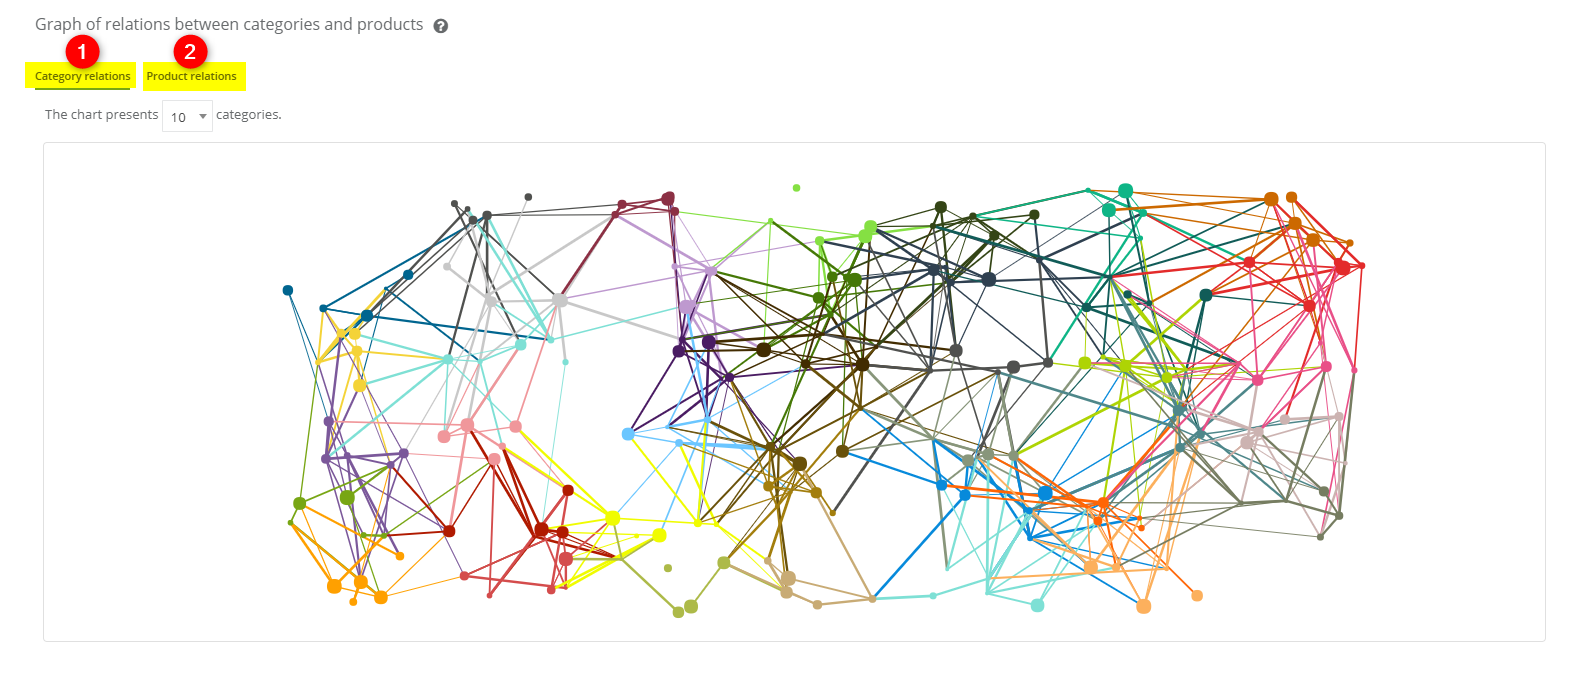
The chart is a graphical representation of the relationship network between categories or products. Dots symbolize categories or products (depending on which kind of relations you have chosen) and the lines represent the recommendation power (that is the degree of recommendation) between the categories or products. The thicker the line is, the stronger recommendation power is.
To generate the graph of relations between categories and products choose the option [1] or [2]. You can see the sentence(s) above the graph that you need to fill in.
[1] Category relations – “The chart presents X categories” – it shows the network of relations between the chosen amount of categories. If you choose the smallest amount of categories (10), the system will show 10 the most popular categories. The higher the number of categories is, the broader the spectrum between the most recommended and the less recommended category is presented.
[2] Product relations – “The chart presents X categories and within the categories, there will be X products. Additionally, for each of the chosen product, the system will include X additional product recommendations” – it shows the network of relations between products assigned to categories, and additionally, each product will contain additional (and chosen) number of recommendations.
3. Top 10 recommended categories and ratio of recommended products
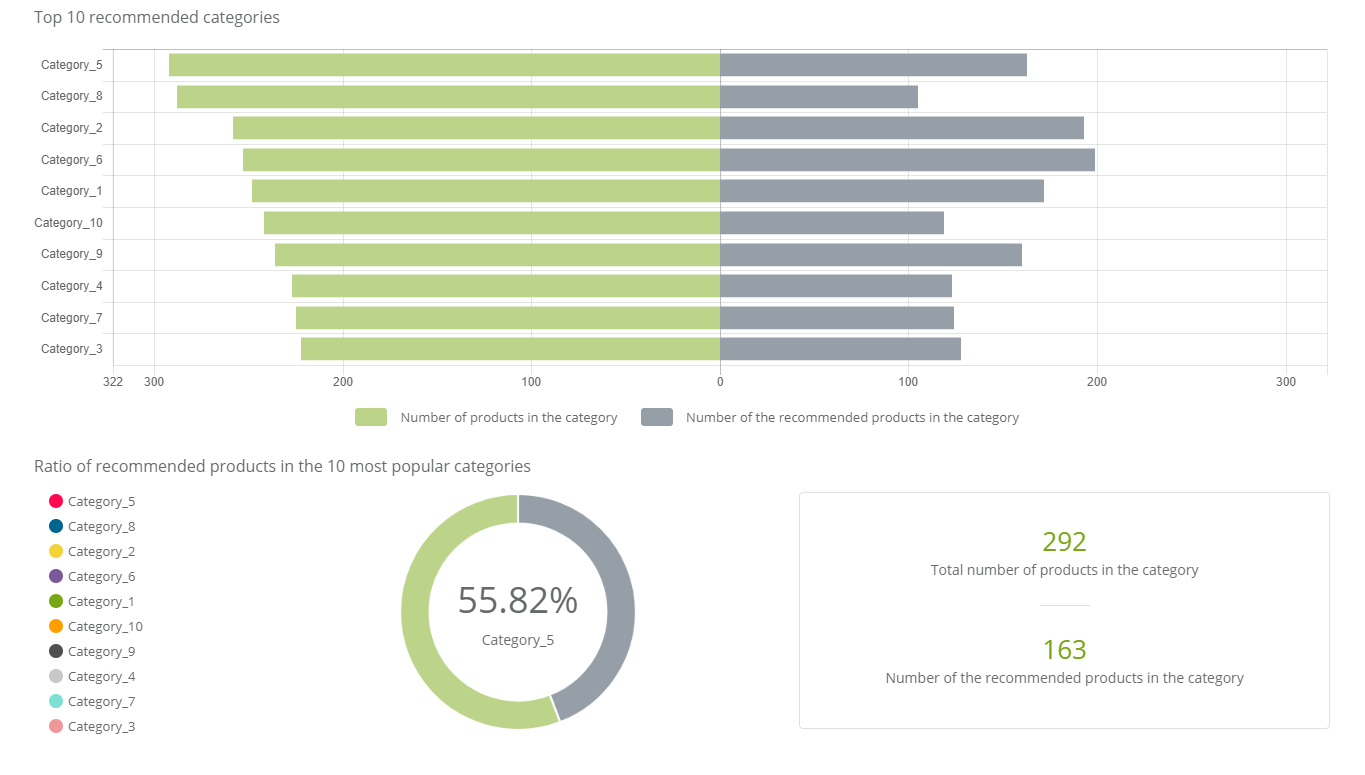
The chart presents the ten most popular recommended categories and depicts the ratio of the number of products in each category to the number of product recommended within the category.
BENEFITS: This way you can analyze quickly the categories that contain the highest number of recommended products and attracts the customers.
The second chart shows the ratio of recommended products in the ten top categories. Click each category and the chart shows the comparison between the recommended and non-recommended products in each category. The table next to the chart displays information concerning the total amount of products in the category and the number of recommended products in the category.
BENEFITS: A clear data presentation enables a quick overview of the ratio of the number of recommended to non-recommended products, thus showing the main objects of customers’ interest. With these pieces of information, you can deplete the product database.
4. Recommendations selected on the basis of the chosen product
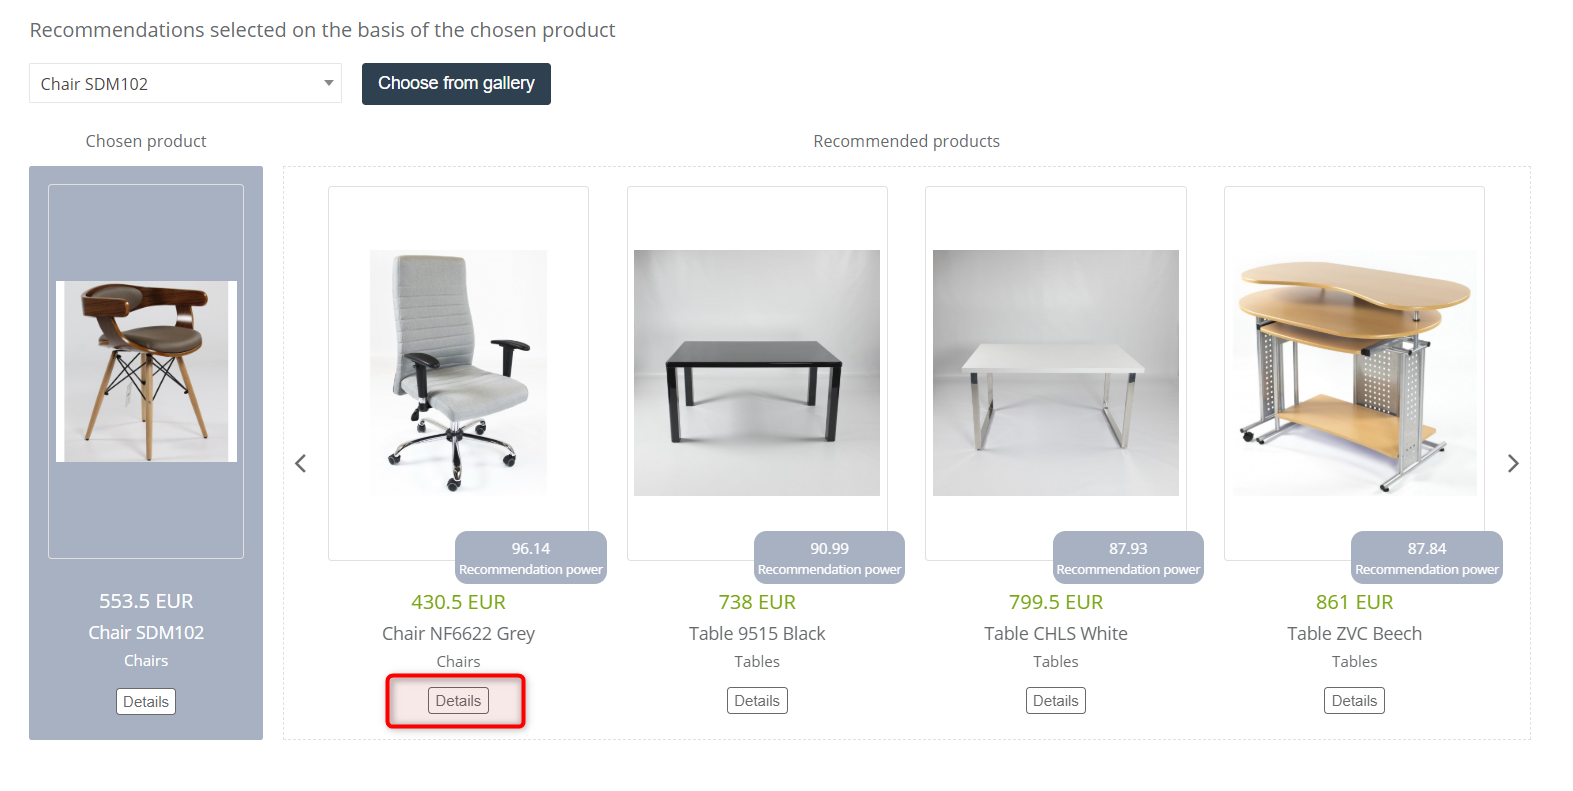
You can take advantage of the section to pick recommended products matching the main product chosen by you. The system will propose the best matches on basis of recommendation power that determines the degree of relations between the products.
Choose the product either from list or gallery. Then the system will prepare the recommended products. Click the Details button to display information about the product (its name, category, price, discounted price, description, etc. – the amount of information depends on the information included in the product feed).
BENEFITS: Use this information to design dynamic emails in which you use the widget Frame with the product to choose. Knowing which products get customers interested, you can draw the attention of other users and increase the chances of conversion.
5. Recommendation selected on the basis of the chosen category
You can take advantage of this section to choose the recommended products to the product chosen by you. In this section, by choosing a product you choose the category of the recommended products by the system. The system will propose the best matches on basis of recommendation power that determines the degree of relations between the products.
Choose the product either from list or gallery. Then the system will prepare the recommended products. Click the Details button to display information about the product (its name, category, price, discounted price, description, etc. – the amount of information depends on the information included in the product feed).
BENEFITS: Use this information to design dynamic emails in which you use the widget Frame with the product to choose. Knowing which products get customers interested, you can draw the attention of other users and increase the chances of conversion.
Submit your review | |


