Useful links
SALESmanago is a Customer Engagement Platform that supports not only your marketing activities but also your sales process. Our analytical dashboards provide you with the insight you need to maximize the impact of your business and drive growth. Apart from the Main Dashboard >>, many features, such as Email Marketing, Web Push, or Lead Generation widgets, have their own analytics, providing crucial information about your marketing and business performance and thus leveraging your Growth Intelligence.
One of the components of SALESmanago analytical dashboards is Sales Analytics, which includes, among other things, an indication of sales driven by SALESmanago (touchpoint) and attributed to SALESmanago (last click). This article explains the difference between the two and how they are calculated.
Contents
1. Touchpoint and last click
SALESmanago offers a broad range of features aimed at encouraging customers to make a purchase. The Main Dashboard offers comprehensive sales analytics:
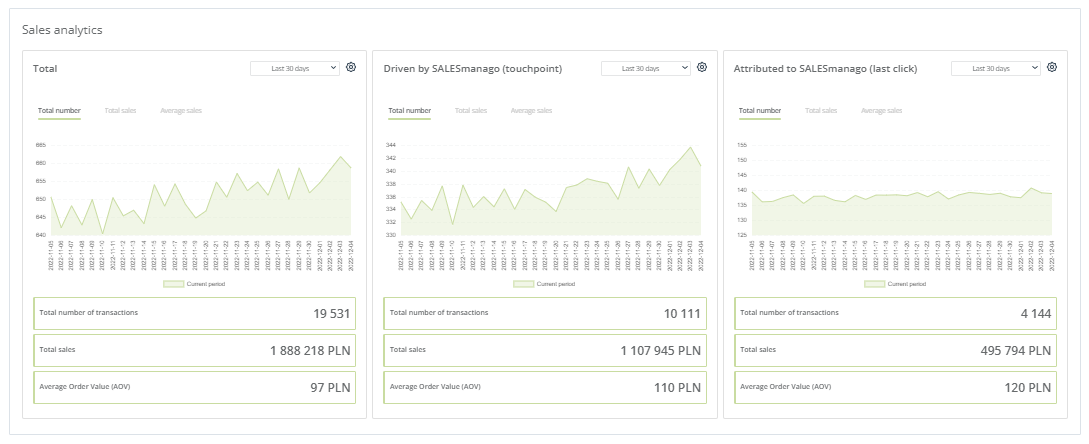
Here, you can review your total sales and what part of them have been supported by SALESmanago.
Two types of sales supported by SALESmanago are distinguished, depending on whether SALESmanago features played a supporting or a decisive role in the customer’s purchase decision:
- Driven by SALESmanago (touchpoint)—transactions transferred to the SALESmanago system in which the purchasing Contact interacted with a marketing communication originating from SALESmanago at least once during their last 25 interactions with your marketing communications, within 90 days preceding the purchase.
- Attributed to SALESmanago (last click)—transactions in which the purchasing Contact’s last touchpoint before the actual transaction was any marketing activity performed via SALESmanago.
A purchase counts as supported by SALESmanago if any of the following events has occurred for the purchasing Contact within 90 days preceding the purchase:
- The Contact opened or clicked an email.
- A text message (SMS) was sent and delivered to the Contact.
- A Web Push was displayed to or clicked by the Contact.
- The Contact clicked on a link (product) in a Recommendation Frame.
- The Contact had an interaction with the Personal Shopping Inbox.
- The Contact used the Search Engine Turbocharger to search for products and clicked on a product.
- The Contact used the Voice Search to search for products and clicked on a product.
Each of these events can count as a “touchpoint” or “last click”, depending on whether it was the last interaction with your marketing communications before the actual purchase (last click) or an earlier interaction (touchpoint).
EXAMPLES:
- A customer receives an email that encourages them to visit your website. The customer clicks a link to see your newest products and immediately makes a purchase. This is a sale attributed to SALESmanago (last click).
- A customer receives an email that encourages them to visit your website. The customer clicks a link to see your newest products but makes no purchase. Two months later, the customer visits your website after clicking an advertisement on a third-party website and makes a purchase. This is a sale driven by SALESmanago (touchpoint).
- A customer visits your website and a Web Push is displayed to them. The Web Push contains a recommendation for a recently viewed product. The customer clicks on that product to view it and then immediately purchases it. This is a sale attributed to SALESmanago (last click).
- A customer visits your website and a Recommendation Frame is displayed to them. They click on a product to view it, but make no purchase. A week later, they come back to your website and purchase this or another product. This is a sale driven by SALESmanago (touchpoint).
- The customer receives a text message (SMS) containing a link to your “Sales” section. They click on the link and immediately make a purchase. This is a sale attributed to SALESmanago (last click).
- A customer clicks on a notification from the Personal Shopping Inbox. Then, they search for information about the recommended product in Google. A month later the customer visits your website after clicking on an advertisement on a third-party website, and makes a purchase. This is a sale driven by SALESmanago (touchpoint).
NOTE: Certain events may not seem like “last clicks,” but will be counted as ones. For example, imagine a situation where a Contact clicks on a product recommendation in an email sent from SALESmanago but makes no purchase. Then, a few hours later, the Contact sees a TV commercial or a billboard advertising your product. The Contact goes back to your website (accessing it directly, through the address bar in their browser) and makes a purchase.
This purchase will be attributed to SALESmanago (last click) because it is technically infeasible to determine whether in the meantime the Contact came across any marketing communications not monitored by the SALESmanago system. However, this attribution is still useful because it shows which of your internet-based campaigns was the last one to contribute to the purchase.
2. Sales analytics in SALESmanago
Sales analytics is provided in different places across the SALESmanago system, at the following levels:
-
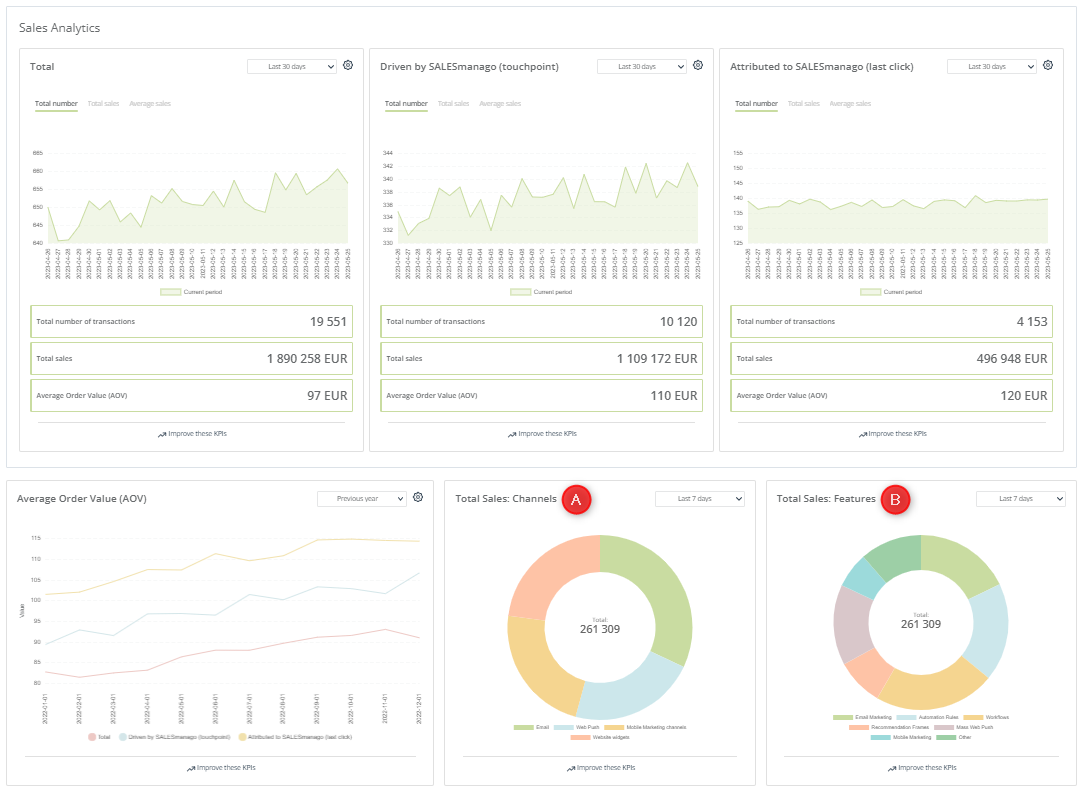
Level 1: On the Main Dashboard >>. Here, you can see analytics for your total sales and specifically for sales supported by SALESmanago.
You can also check how much of your revenue is generated through individual channels [A] (Email, Web Push, Mobile Marketing channels, and Website widgets) and through individual features [B] (Email Marketing, Automation Rules, Workflows, Recommendation Frames, Mass Web Push, Mobile Marketing, Other). Note that charts [A] and [B] show sales both driven by and attributed to SALESmanago.
-
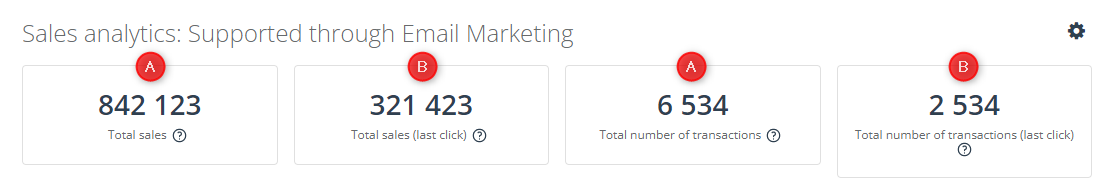
Level 2: Within individual features. At this level, you can see what part of your sales was supported by individual features.In this case, the “total sales” value refers to sales driven by and attributed to that individual feature. Additionally, a separate tile specifically shows sales attributed to that feature (last click).EXAMPLE: Email Marketing Dashboard:
Tiles [A] show the revenue and the number of transactions both driven by and attributed to the Email Marketing feature (touchpoint and last click). Tiles [B] show only the revenue and the number of transactions attributed to the Email Marketing feature (last click).
-
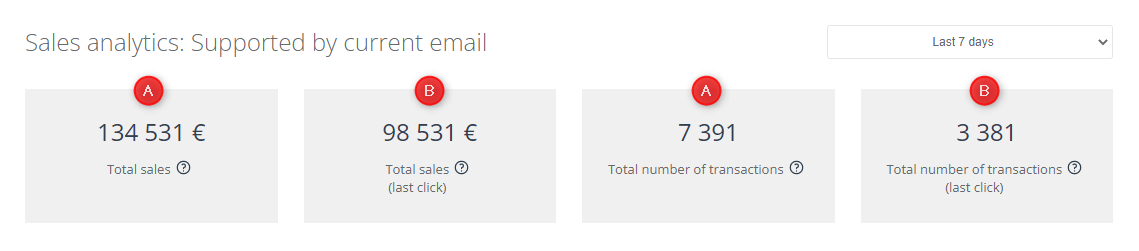
Level 3: In the analytics of individual marketing communications. Here, you can see what part of your sales was supported by individual communications (or individual processes, in the case of Automation Rules and Workflows).
In this case, the “total sales” value refers to sales driven by and attributed to that individual communication. Additionally, a separate tile specifically shows sales attributed to that communication (last click).
EXAMPLE: Analytics of an individual email:
Tiles [A] show the revenue and the number of transactions both driven by and attributed to this specific email (touchpoint and last click). Tiles [B] show only the revenue and the number of transactions attributed to this specific email (last click).
Note that even if a Contact opens or clicks a marketing communication many times, this will count as one interaction.
EXAMPLE: A Contact receives an email and opens it, but does not click through. A few days later, the same Contact opens the same email and clicks through. Two weeks later the same Contact opens the same email, clicks through, and makes a purchase on your website.
All these interactions will be counted as one transaction in the analytics of the Email Marketing feature (Level 2) and of that specific email (Level 3). Note that this is a sale attributed to SALESmanago (last click), so this transaction will be included in the values of both [A] and [B]:
The rules for calculating the results shown in sales analytics differ from level to level. This is why sometimes you can get the impression that the results do not add up. For an explanation, see Section A below.
A. Why do your results (seemingly) not add up?
Sometimes, if you compare the results shown in the different places in the system, you may get the impression that they do not add up, or that different values are shown for the same channel or feature in different analytical panels.
This is because the rules for calculating the results shown in sales analytics differ from level to level, where:
- Level 1 is the Main Dashboard,
- Level 2 are the analytical panels for individual features, and
- Level 3 are the analytical panels for individual marketing communications or processes (e.g., individual emails, Web Push notifications, or Workflow processes).
When monitoring your sales analytics, please consider the following factors:
- A single transaction can be supported by many features and many marketing communications.
- A single transaction will only be included once in each diagram on the Main Dashboard (at Level 1), but can be included in the revenue analytics of many individual features (at Level 2) and many individual communications (at Level 3).
- Even if more than one SALESmanago channel or feature is involved in a transaction, on the Main Dashboard, that transaction is attributed to only one channel and only one feature—the one that was the last point of interaction with your marketing communications originating from SALESmanago. Bear this in mind when analyzing the Total Sales: Channels and Total Sales: Features charts and comparing them with the revenue analytics for individual features.EXAMPLE: On the Main Dashboard, the Total Sales: Features chart shows a revenue of 100,000 for the Workflow feature.
However, when you go to Menu → Automations → Automation Processes → Dashboard → Workflow tab, you see that the sales supported by Workflows amounted to 150,000 for Total sales and 50,000 for Total sales (last click).
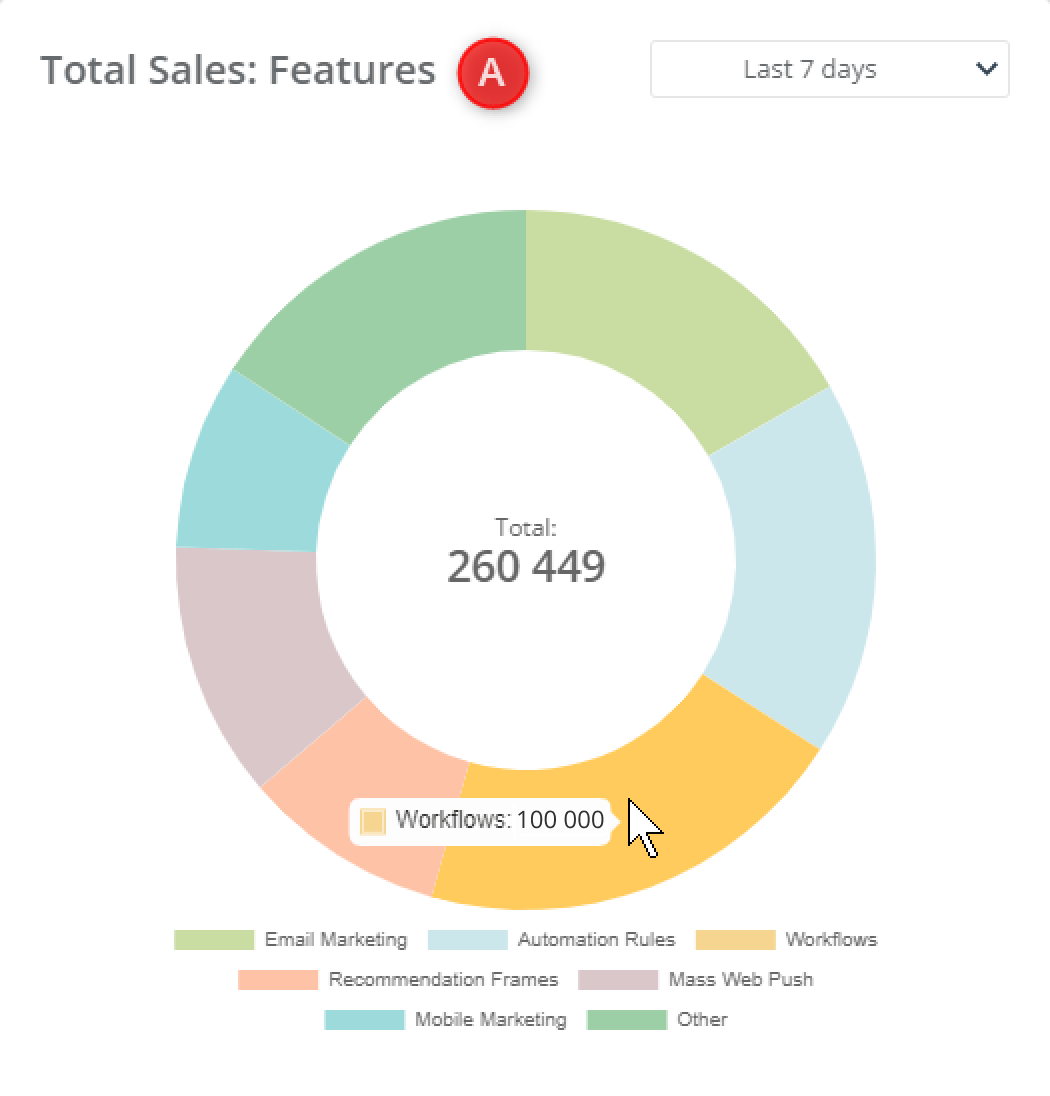 This is because the Total Sales: Features [A] chart shows transactions driven by and attributed to SALESmanago in which a Workflow process was the last point of interaction of all interactions originating from SALESmanago (but not necessarily “last click”). The Total sales [B] tile, in turn, includes all transactions in which a Workflow was a point of interaction (at any stage of the marketing process). The Total sales (last click) [C] tile includes only those transactions in which a Workflow was the last point of interaction of all interactions in general (both originating and not originating from SALESmanago).
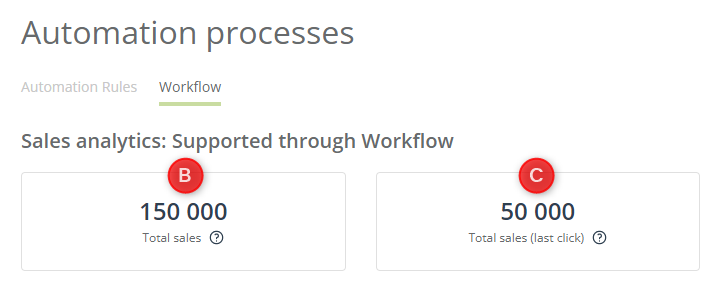
Also, bear in mind that an interaction with a marketing communication sent through an Automation Rule or a Workflow will be counted as an interaction with that Automation Process. This means that the revenue from any resultant purchases will be attributed to the Automation Rule feature or the Workflow feature.
This applies also to the Total Sales: Features chart on the Main Dashboard.
EXAMPLE: A Contact opens an email sent from a Workflow, clicks on a link included in that email, and immediately makes a purchase.Note that this is a transaction attributed to SALESmanago (last click).
This transaction will be included:
- At Level 1 (on the Main Dashboard): In all three Sales Analytics charts (Total, Driven by SALESmanago, and Attributed to SALESmanago); in the Total Sales: Channels chart (under Email); and in the Total Sales: Features chart (under Workflow).
- At Level 2: In the sales analytics of the Workflow feature: Total sales and Total sales (last click).The transaction will not be included in the analytics of the Email Marketing feature (because the email was sent from a Workflow, and the revenue is attributed to the Workflow feature).
- At Level 3: In the individual analytics of that specific Workflow process: Total sales and Total sales (last click).The transaction will not be included in the analytics of that individual email message (because the email was sent from a Workflow and the revenue is attributed to the Workflow feature).
Below, you can find another example that comprehensively illustrates the revenue attribution rules on the SALESmanago platform.
EXAMPLE: Before making a purchase, a Contact has the following interactions with your marketing communications (listed in the order of occurrence, from the earliest to the latest):
- Opens three different emails sent from SALESmanago.
- Clicks on a product recommendation in a Web Push notification sent from SALESmanago.
- Clicks on a product in a SALESmanago Recommendation Frame.
- Opens an email sent from a SALESmanago Workflow.
- Clicks on an advertisement on a third-party website and makes a purchase in your store.
This transaction will be included:
-
At Level 1 (on the Main Dashboard):
- In two Sales Analytics charts (Total and Driven by SALESmanago).
- In Total Sales: Channels (under Email).
- In Total Sales: Features (under Workflow).
-
At Level 2:
- In the sales analytics of the Email Marketing feature: in Total sales.
- In the sales analytics of the Web Push feature: in Total sales.
- In the sales analytics of the Workflow feature: in Total sales, but not Total sales (last click). This is because the Workflow process was the last point of interaction of all interactions originating from SALESmanago, but not of all interactions in general.
-
At Level 3:
- In the individual analytics of all three emails: in Total sales.
- In the individual analytics of the Web Push notification: in Total sales.
- In the individual analytics of the Recommendation Frame.
- In the individual analytics of the Workflow process: in Total sales, but not Total sales (last click).
Although the revenue attribution model may seem complex, it is designed to provide you with the most reliable insights.
Make sure to track your statistics to check what part of your total sales comes from Marketing Automation. Measure the revenue generated through all your communication channels and use this knowledge to refine your strategy based on the best-performing features.