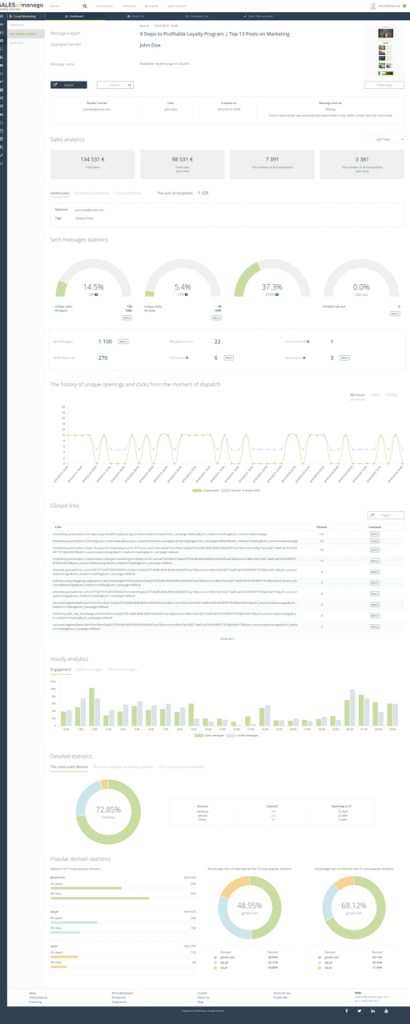
In SALESmanago, you can easily analyze the statistics of sent emails. Check the details of your campaign’s deliverability, its open and click results, and other detailed information to better understand your customers’ reaction about content that you send.
To go to the statistic of a given email go to
Channels → Email Marketing → Email Analytics → Sent tab → individual e-mail Analytics
Contents
- Basic information and clicks map
- Sales analytics
- Recipients details
- Sent messages statistics
- The history of unique openings and clicks from the moment of dispatch
- Clicked links
- Hourly analytics
- Detailed statistics
- Popular domain statistics
1. Basic information and clicks map
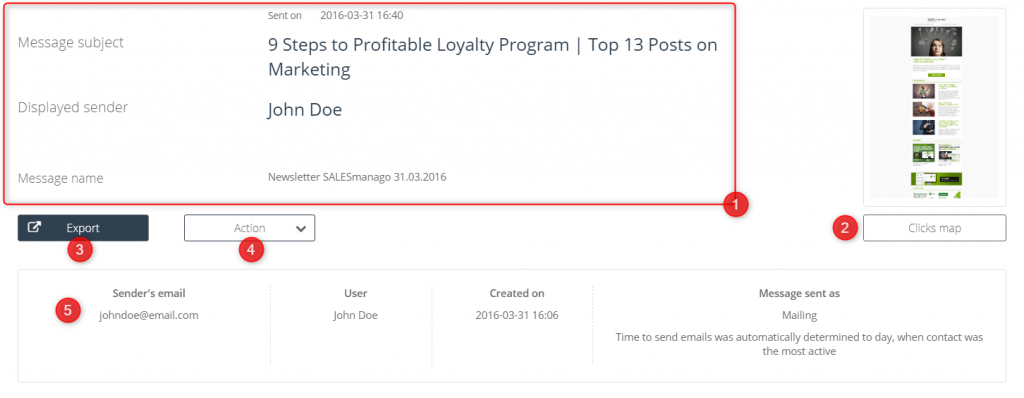
[1] On the top of the page you can find basic information about the mailing, as a: message subject, displayed sender, sent date, and message name.
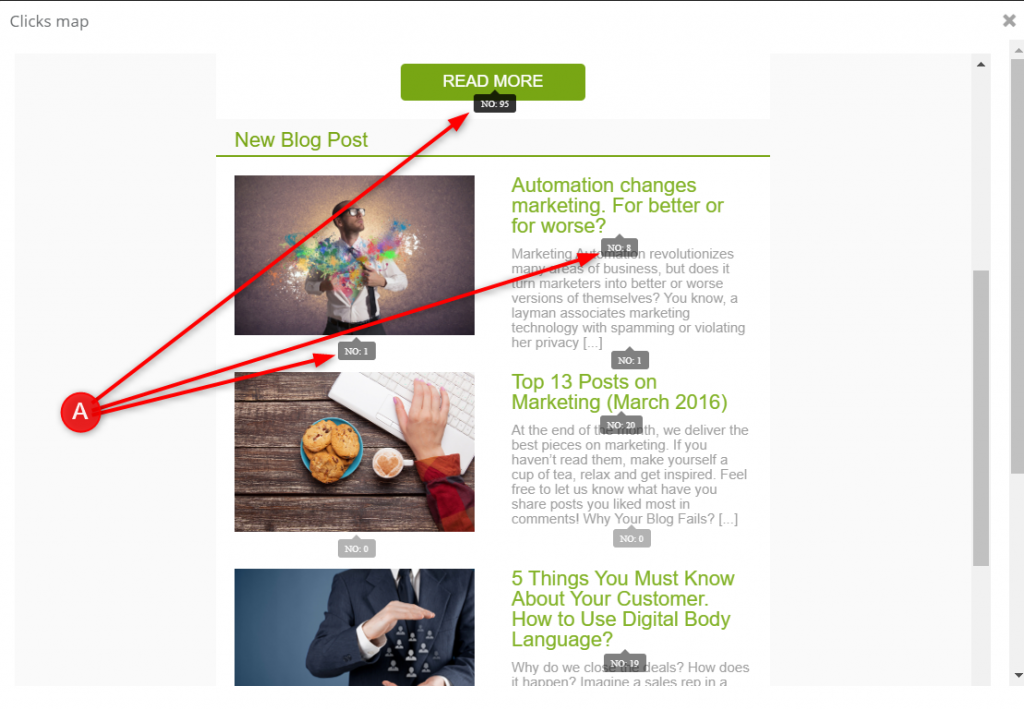
[2] Clicks map – open it to analyze the number of clicks in a given link in the mailing. [A] All data will be shown like in the picture below:
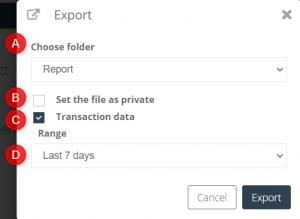
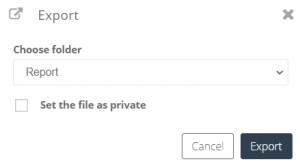
[3] Export – click the button to export a given mailing:
[A] Choose folder – choose the folder to which you want to export data,
[B] You can set the file as private if you don’t want that anyone else except you has access to this mailing.
[C] Transaction data – click it to export transaction data (sales analytics) for a given email. You can choose the time range of exported data [D].
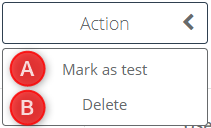
[4] Action – choose an Action that you want to make on the mailing:
[A] Mark as test – mark email as a test one, if you choose this option the message from the analytics will automatically be deleted and will not be counted in the statistics.
[B] Delete – delete this mailing analytic.
[5] Advanced information about the mailing – in this window you can see the sender’s email, user name in the system, creation date, and type of message.
2. Sales analytics
In Sales analytics you can see total sales, total sales last click – it is the source of transaction which took place shortly before the transaction (that led the contact to your website), the number of all transactions, the number of all transactions (last click).
3. Recipients details
In Recipients details, you can see the sum of them.
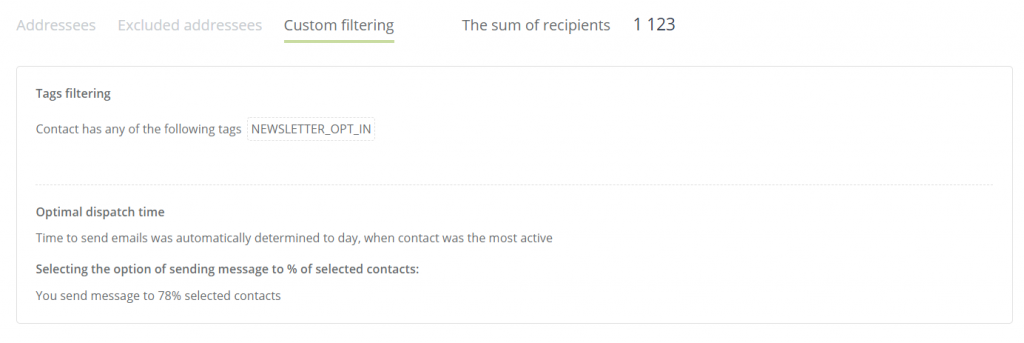
Title panel is divided into three sections, in what you can check the following information:
Addressees – based on what selectors and tags mailing list was created.
Excluded addressees – based on what tags addressees were excluded.
Custom filtering
- Based on what filters mailing addressees were chosen, e.g. contact has any of the following tags
- Optimal dispatch time – on what time dispatch was planned.
- Option of sending message to % of selected contacts – you can select the percent of your mailing base to which you want to send the mailing.
4. Sent messages statistics
In sent messages statistic you can find information about the rate of: unique opens to sent messages (average OR), unique clicks to all clicks (average CTR), unique clicks to unique opens (average CTOR), and opted-out contacts to all contacts. Additionally, by clicking the button “Who” you can preview a list of specific contacts from your contacts list that made chosen action.
In a frame under the graphically previewed sent message statistics are displayed the most important information about the given email:
- The number of sent messages
- The number of messages to send
- The number of incorrect emails – the contacts the email hasn’t been sent to due to opt-out or invalid status.
- The number of SPAM reporting
- The number of soft bounce – indicator showing the number of undelivered messages. The reason for the undelivered status is temporary and probably the message will be sent out successfully next time (for e.g. contact has a full inbox).
- The number of hard bounce – indicator showing the number of undelivered messages. The reason for the undelivered status is permanent and there is no sense in sending emails again to the group of contacts (e.g. provided email address doesn’t exist).
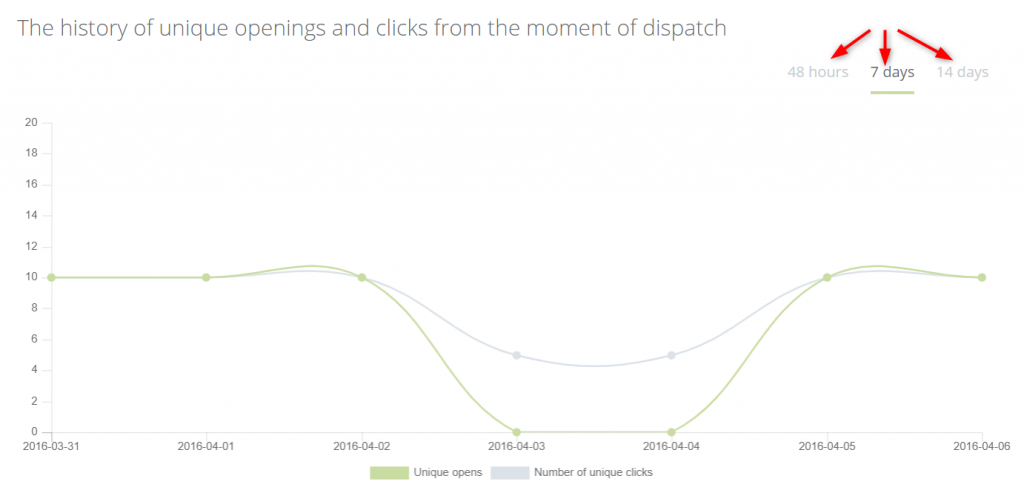
5. The history of unique openings and clicks from the moment of dispatch
In this place, the history of unique openings and clicks from the moment of dispatch is displayed graphically. You can select from what time you want to see the following information: last 48 hours, 7 days, or 14 days.
6. Clicked links
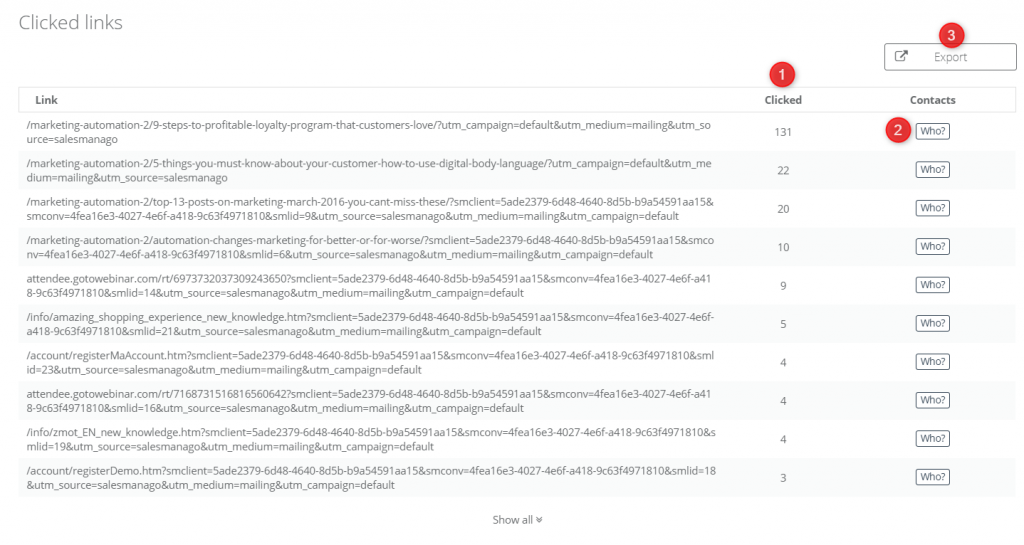
[1] Clicked – links in this panel are sorted by decreasing number of clicks. On the top, you can see links from the emails with the highest number of clicks, and on the bottom with the lowest.
[2] Contacts – after clicking the “Who?” button you can preview who from your contacts list click in a given link.
[3] Export – export data about the number of clicks in links.
Choose a folder to which one you want to export files if you want to set the file as private.
7. Hourly analytics
[A] Engagement – bar charts comparison on the hourly schedule of your open messages to clicked messages. Percentage of openings and clicks in a given range
[B] Open messages – bar chart on the hourly schedule of opening your emails. The percentage of openings in a given hour in relation to all openings.
[C] Clicked messages – bar chart on the hourly schedule of clicking your emails. The percentage of clicks in a given hour in relation to all clicks.
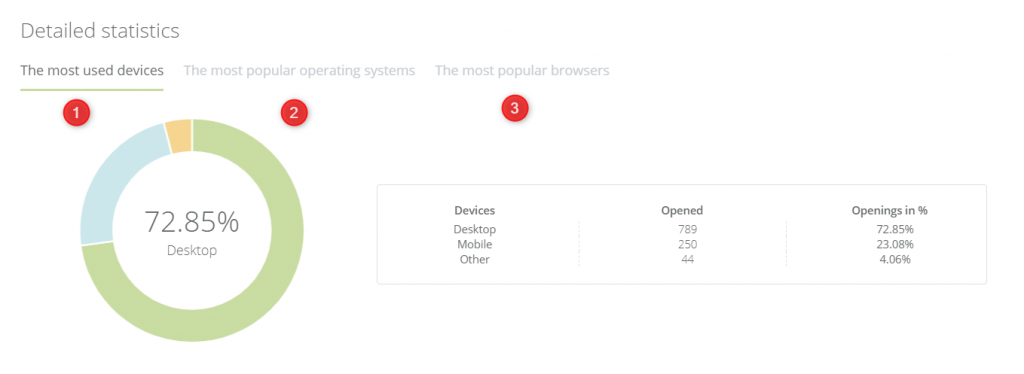
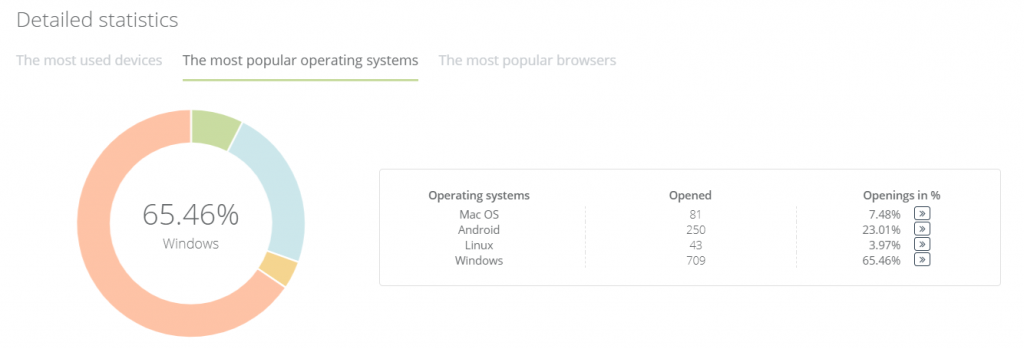
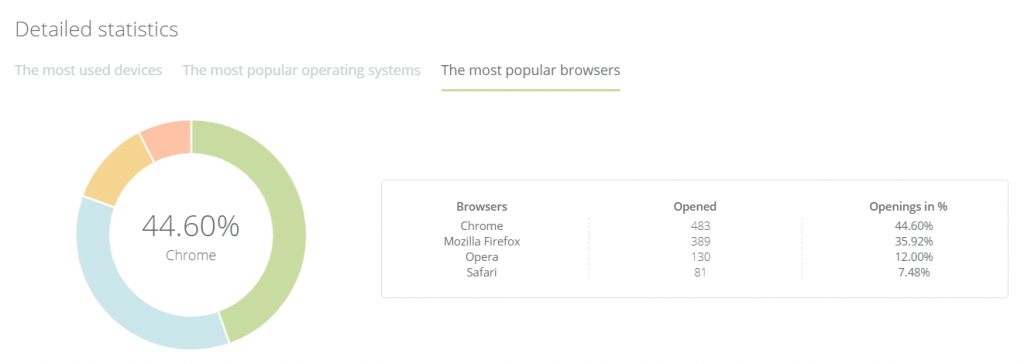
8. Detailed statistics
[A] The most used devices – on the circle chart you can see displayed information in percent about the number of opened emails on the given device in ratio to summed number of opened emails.
[B] The most popular operating systems – on the circle chart you can see displayed information in percent about the number of opened emails on the given operating system in ratio to summed number of opened emails.
[C] The most popular browsers – on the circle chart you can see displayed information in percent about the number of opened emails on the given browser in ratio to summed number of opened emails.
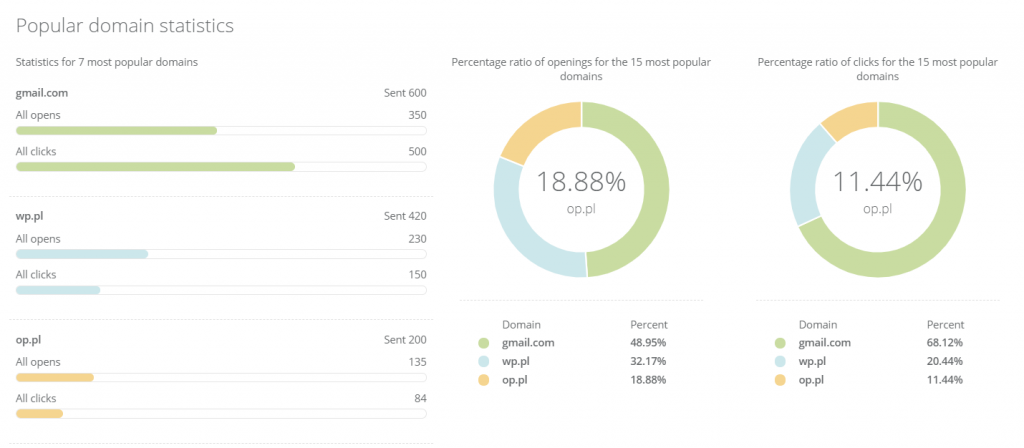
9. Popular domain statistics
In this panel, you cand find the information displayed on the circle chart about a statistic for the most popular domains from which are openings and clickings of emails.
