Useful links
Nowadays marketing focuses on reaching the individual consumer. Mass communication is not beneficial enough. Maximized content personalization is required. To create a suitable offer for our client we should learn more about him. Thanks to SALESmanago RFM solution, we have such an opportunity.
RFM Marketing Automation allows conducting highly detailed customer analysis. Due to generating specific data, it is possible to distinguish regular customers from cyclic customers and customers that need to be fought back. This kind of distinction will help us plan more efficient strategy. The primary goal is to emerge most active individuals and appreciate them. We can contact the seasonal group at its highest activity and try to renew the relationship with the ones that purchase occasionally.
RFM Marketing Automation is an analytical dashboard that recycles three pieces of information about customer activity:
Recency (Period from the last purchase) – who recently made a purchase. People who have recently bought your product or use our services are more open to a new transaction.
Frequency (Frequency of purchase) – who and how regularly buys our products or use our services. This information helps to predict next transaction and define its regularity.
Monetary Value (Monetary income) – who spends money more at a certain time. It helps to distinguish the most loyal and reliable customers.
Data above analyzed together give client character ratio. It allows us to think ahead and predict people behavior but also act in advance.
IMPORTANT: It is possible to create maximum two analytical dashboards.
To create RFM Marketing Automation analytical panel go to
Audiences → Segmentation → RFM Analysis
Contents
- Basic settings
- Recency settings
- Frequency settings
- Monetary settings
- Summary
1. Basic settings

[1] Name – insert the name of the analytics.
[2] Analyze data since – the data will be investigated from the chosen date. Data can be analyzed maximum from 365 days back, and that is why the earliest date is set by default. It is required to insert the exact date.
EXAMPLE: If you set the date on 20th of July, 2016, so the earliest day that the data can be analyzed can reach as far as 20th of July, 2015. If the data wasn’t collected, then the system will use those that were collected.
[3] Transaction filter – choose an external event. Through this event, a group of contacts will be analyzed. The group defined below:
Transaction type – It is possible to choose more than one transaction type:
- Purchase – making a purchase on the website (external event: purchase),
- Visit – visiting the website (external event: visit),
- Cart – abandoned cart (external event: cart).
EXAMPLE: You can create one analytical dashboard for customer segmentation due to the value of their purchases and one for customer segmentation due to the value of abandoned cart.
[4] Contacts filter – we need to define the contact group that we want to analyze. We can do that by choosing tags.
[5] Has all of the following tags – contact has to have every mentioned tag.
[6] Has any of the following tags – contact has to have at least one of the mentioned tags.
[7] Currency – in basic settings it is important to set the currency you want to display in the sales report to present data. It is the currency that customers use to pay for products/services. Currency is obligatory to set a dashboard. You can choose among the dozens of options, including:
- USD – Dollar,
- EUR – Euro,
- PLN – Polish Zloty.
To proceed press Next.
2. Recency settings
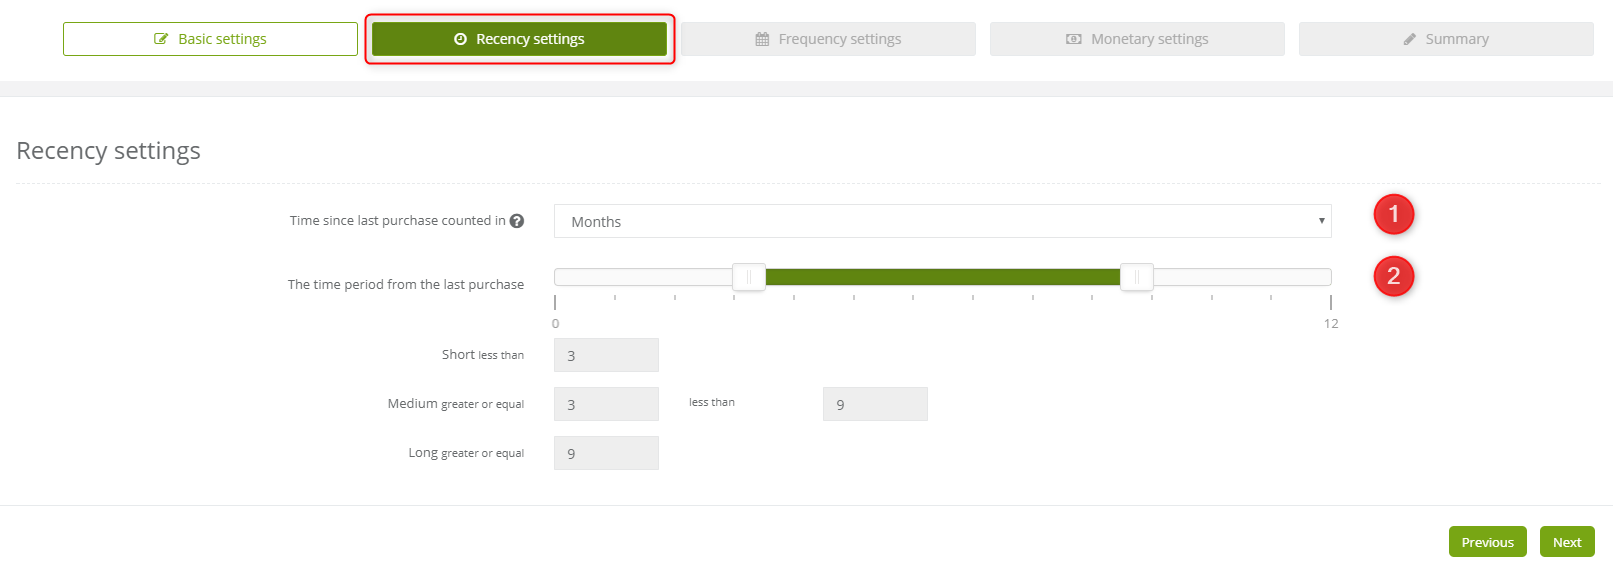
[1] Time since last purchase counted in – you need to choose units you would count the last purchase in. You can choose months or days. That way the scale slider is adjusting.
[2] The time period from the last purchase – you also need to mark the period from the last purchase of contact. You can do that by sliding the white boxes on the scale.
After you adjust the parameters, periods of contact purchase display below:
- Short,
- Medium,
- Long.
To proceed press Next.
3. Frequency settings
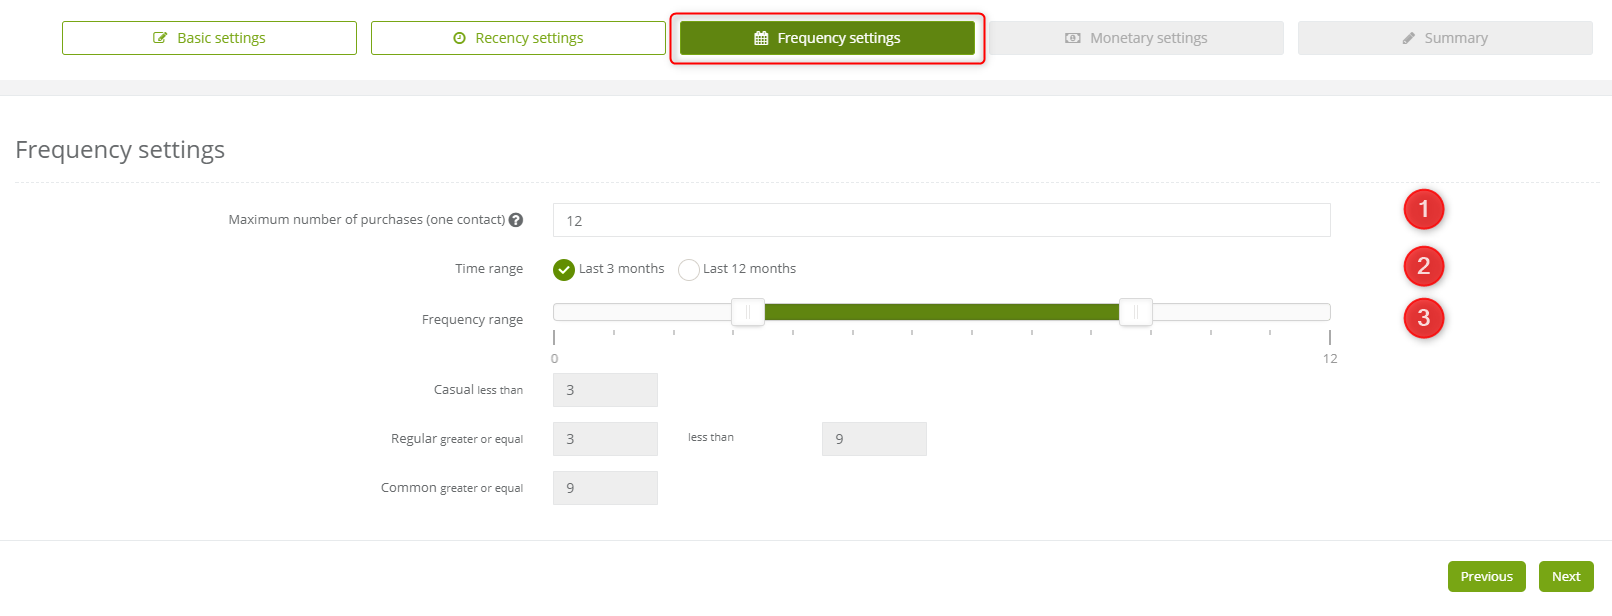
[1] Maximum number of purchases (one contact) – we need to set a Maximum number of purchases by one contact in a certain period. That way the scale slider is adjusting.
[2] Time range – period for which the frequency will be analyzed.
[3] Frequency range – we need to mark the number of made transactions in the chosen period. We can do that by sliding white boxes on the scale.
After we set the parameters, the frequency of purchases displays below:
- Casual,
- Regular,
- Common.
To proceed press Next.
4. Monetary settings
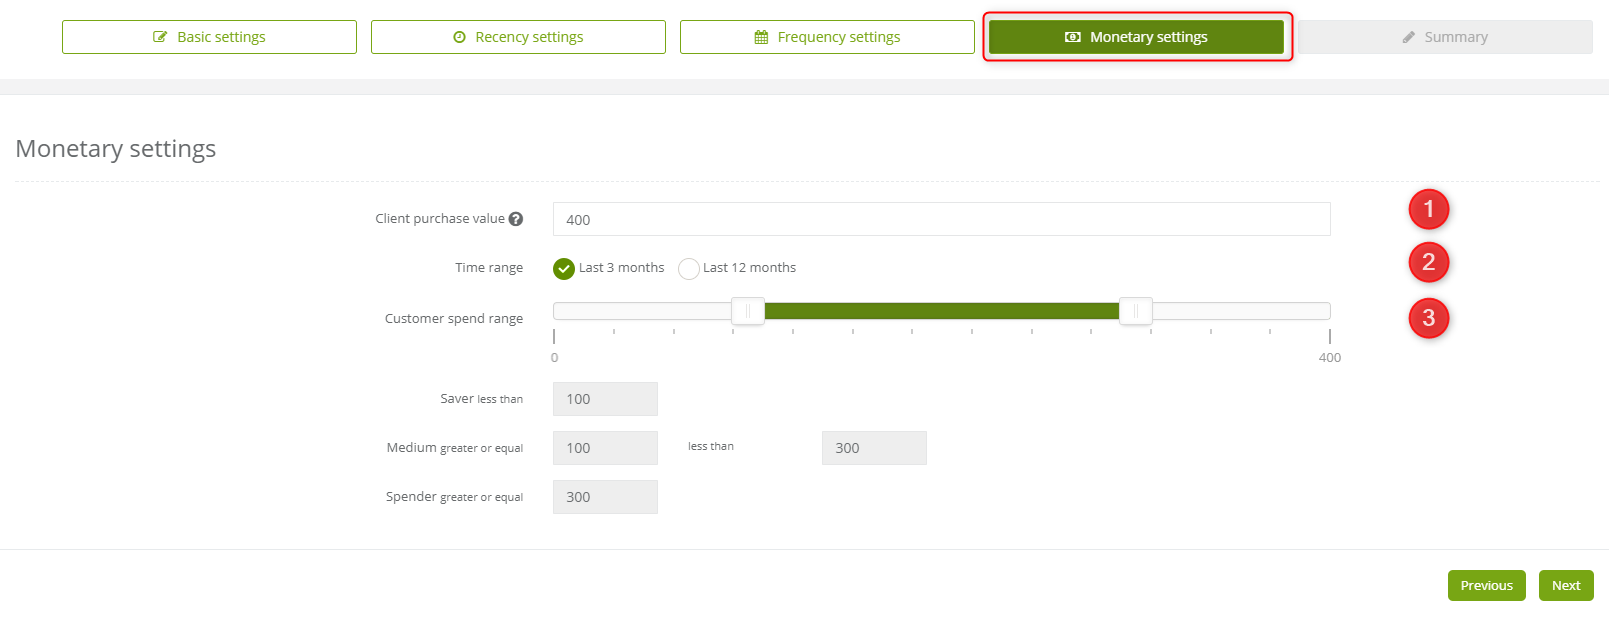
[1] Client purchase value – we need to specify the value of the customer’s purchase. That way the scale slider is adjusting.
[2] Time range – time period for which the frequency will be analyzed.
[3] Customer spend range – we need to mark the value of made transactions in chosen period. We can do that by sliding white boxes on the scale.
After we set the parameters, amount of spending displays below:
- Saver,
- Medium,
- Spender.
To proceed press Next.
5. Summary
