Predefined sales dashboard presents the most crucial information in the view of sales activities. The widget configuration on the sales dashboard is connected strictly with monitoring the number and value of any kind of transactions (purchases and abandoned carts). This widget arrangement is exemplary and it can be edited and suited to one’s needs.
To display and configure sales dashboard you need to go to
START
Contents
- Widget selection
a) transactions - Editing
a) widget editing
b) widget size adjustment
c) choosing the space on the dashboard for a widget
1. Widget selection
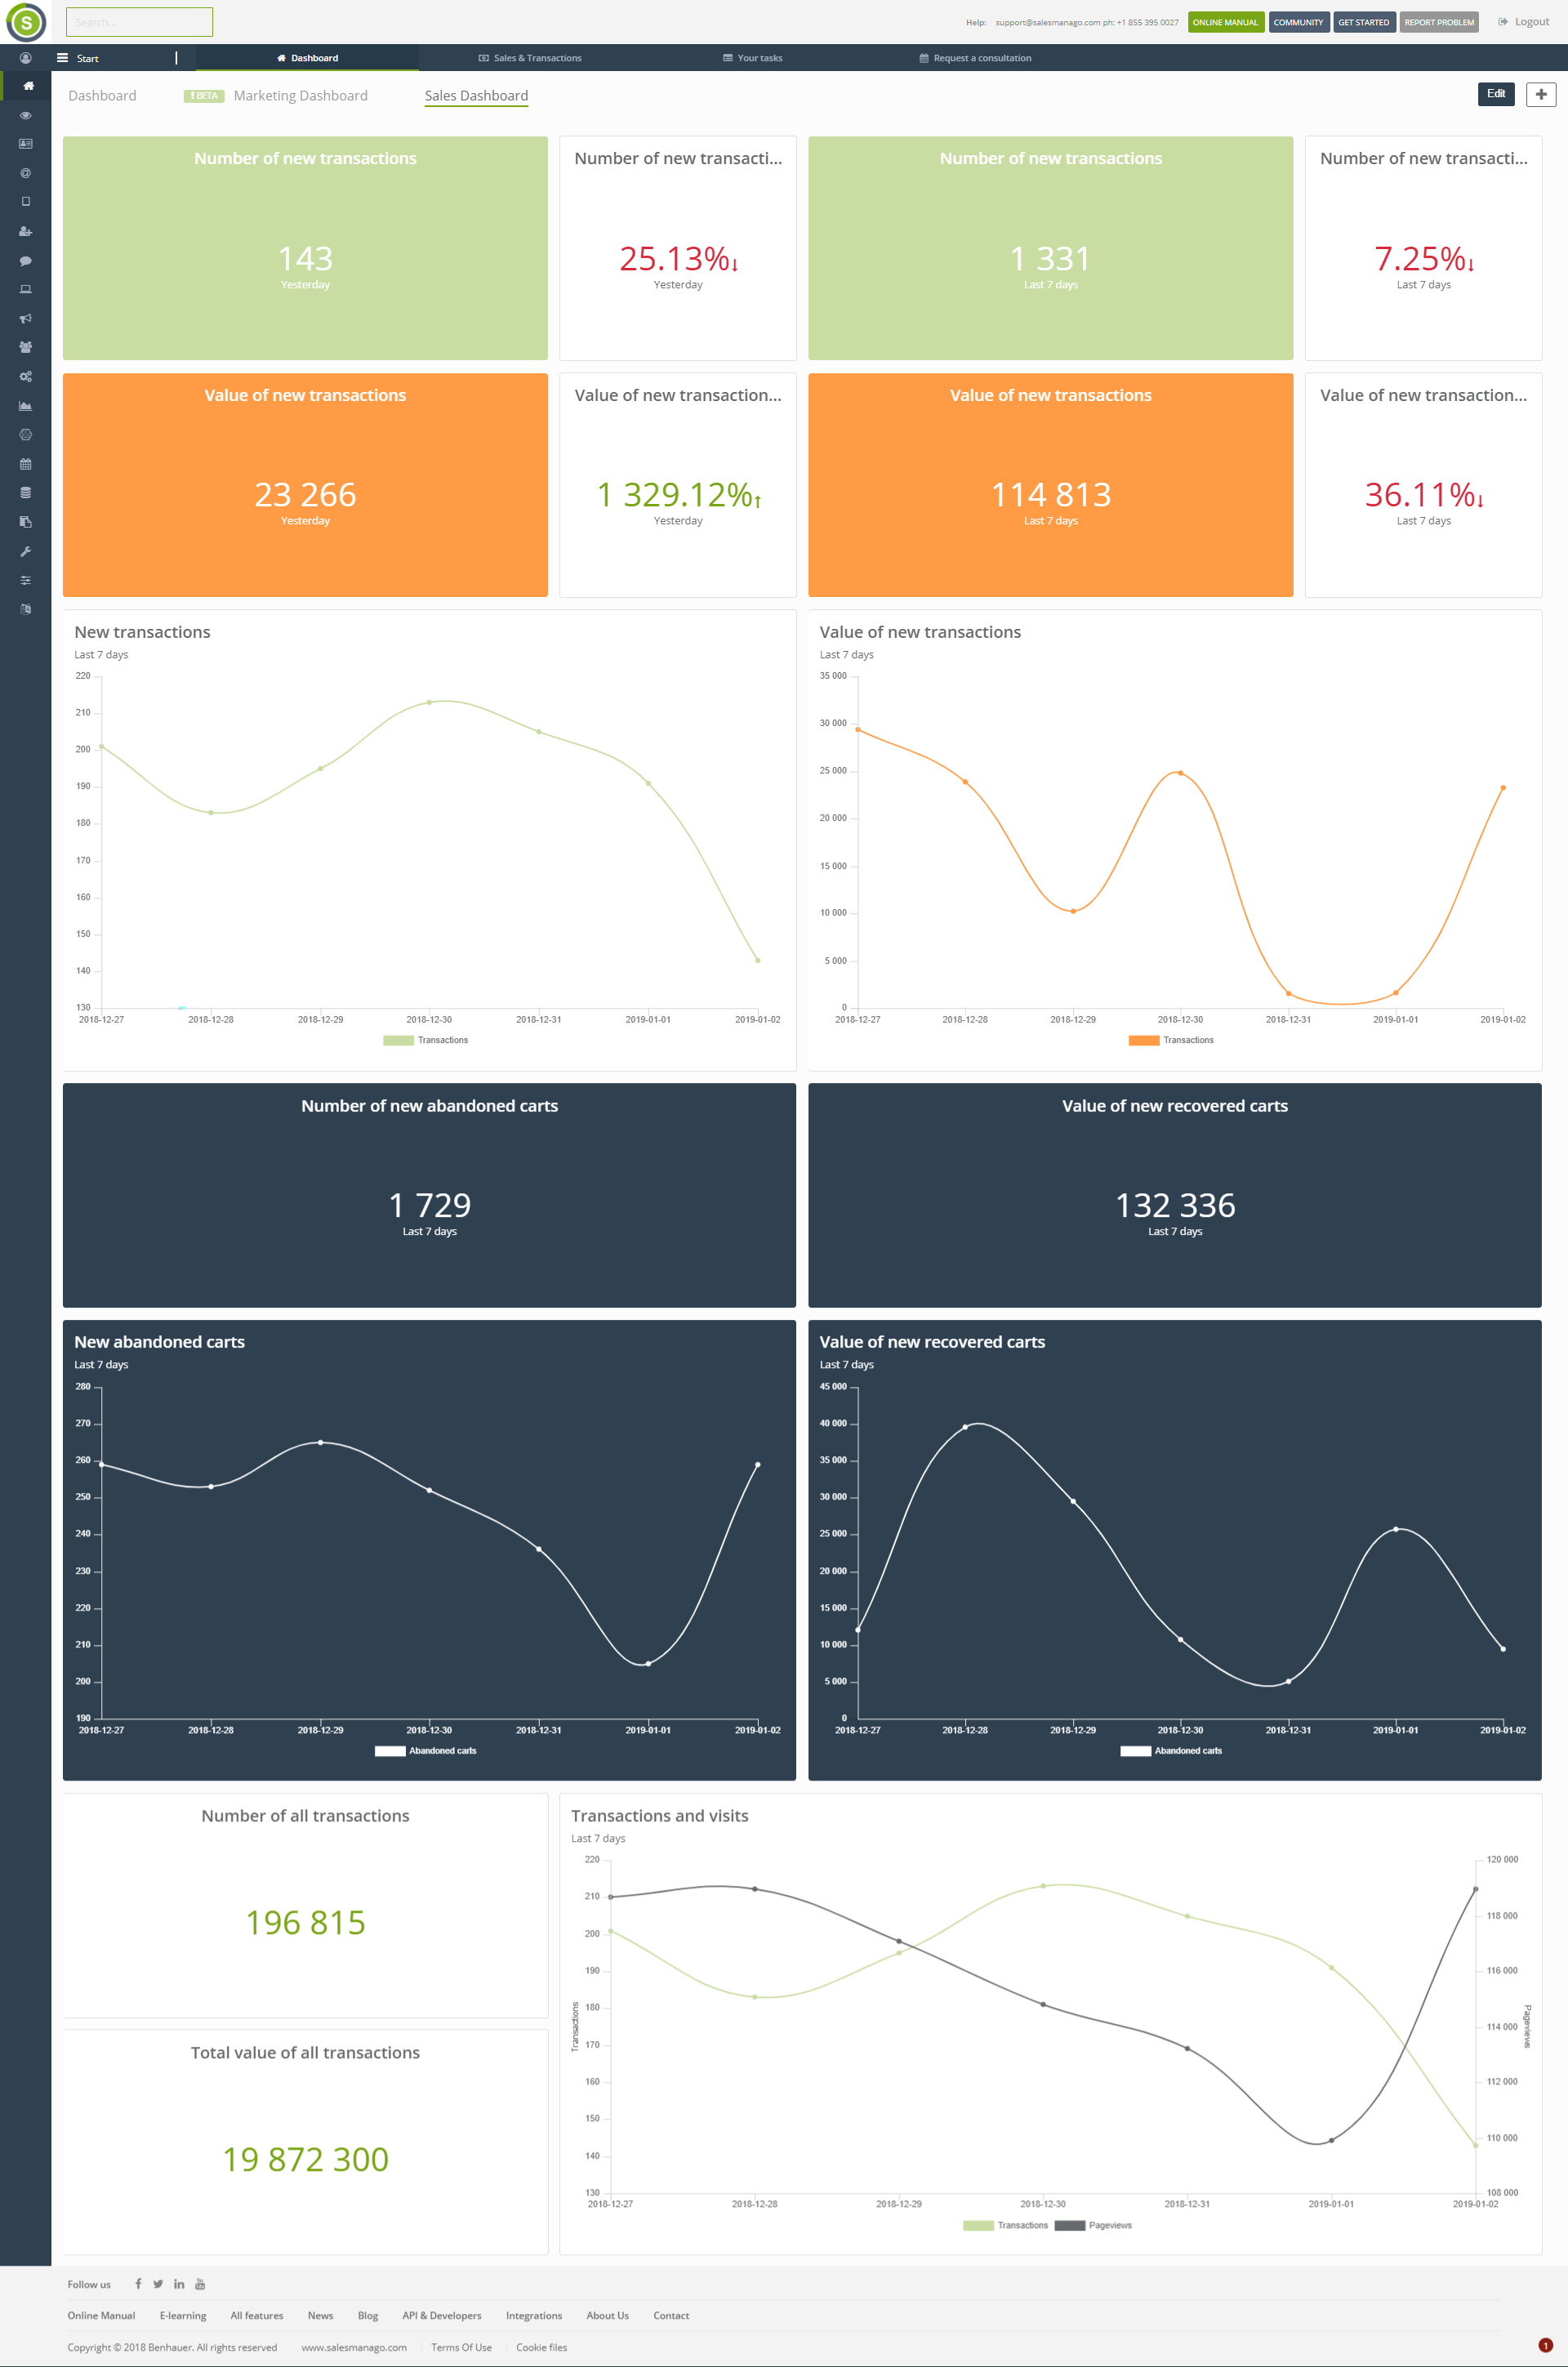
[1] – all widgets used on the sales dashboard have been chosen from the group Transactions which is available in the widget library. Click the button Edit to enable the option.
- Number of new transactions – the widget presents the statistics concerned with the recent transactions finalized in the specific time period. This widget has been added twice to the dashboard, though each widget has different time frames set.
- Number of new transactions – comparison – the widget shows the comparison of the number of transactions between two time periods. The illustration above shows the comparison between yesterday and the last 7 days. If it comes to the first option, that is yesterday, the system compares the results achieved yesterday and the day before. Whereas the second option concerns the comparison between last days (which can include the current day) and other seven days that precede.
- Value of new transactions – the widget that shows the monetary value of transactions from the specified time period. This widget has been added twice to the dashboard, though each widget has different time frames set. The currency corresponds with the currency used in the e-shop.
- Value of new transactions – comparison – the widget presents the comparison of the value of the new transactions from the specified time period. This widget has been added twice to the dashboard, though each widget has different time frames set. The illustration above shows the comparison between yesterday and the last 7 days. If it comes to the first option, that is yesterday, the system compares the results achieved yesterday and the day before. Whereas the second option concerns the comparison between last days (which can include the current day) and other seven days that precede.
- Charts – the charts reflect the fluctuation of the contact base state for specific time periods.
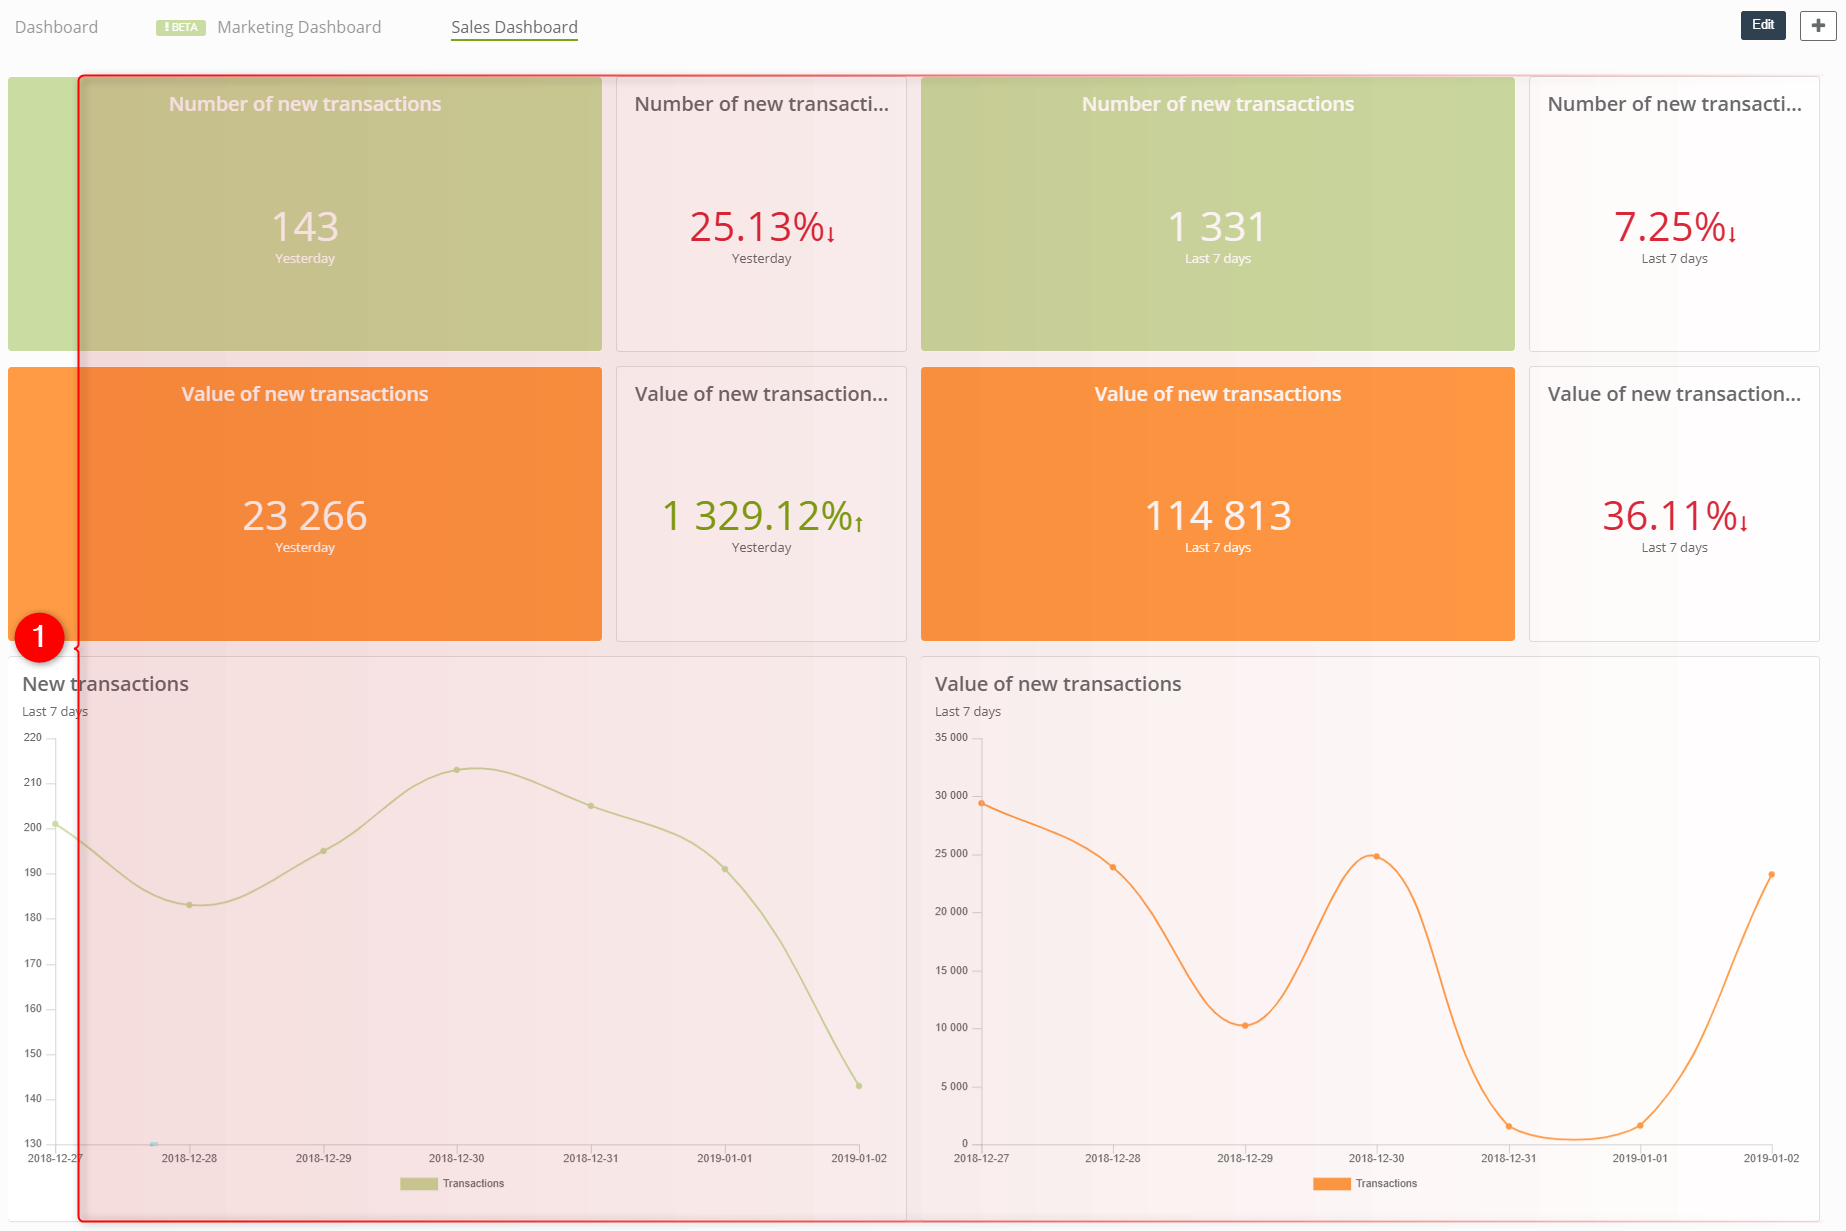
[2] – all widgets used on the sales dashboard have been chosen from the group Transactions which is available in the widget library .
- Number of new abandoned carts – the widget that shows the statistics that regard the number of ceased and unfinished transactions in the chosen period.
- Value of new abandoned carts – the widget that shows the monetary value of the unfinished transactions in the chosen period. The currency corresponds with the currency used in the e-shop.
- Charts – the charts depict the fluctuation of the number and value of unfinished transactions at the specific time.
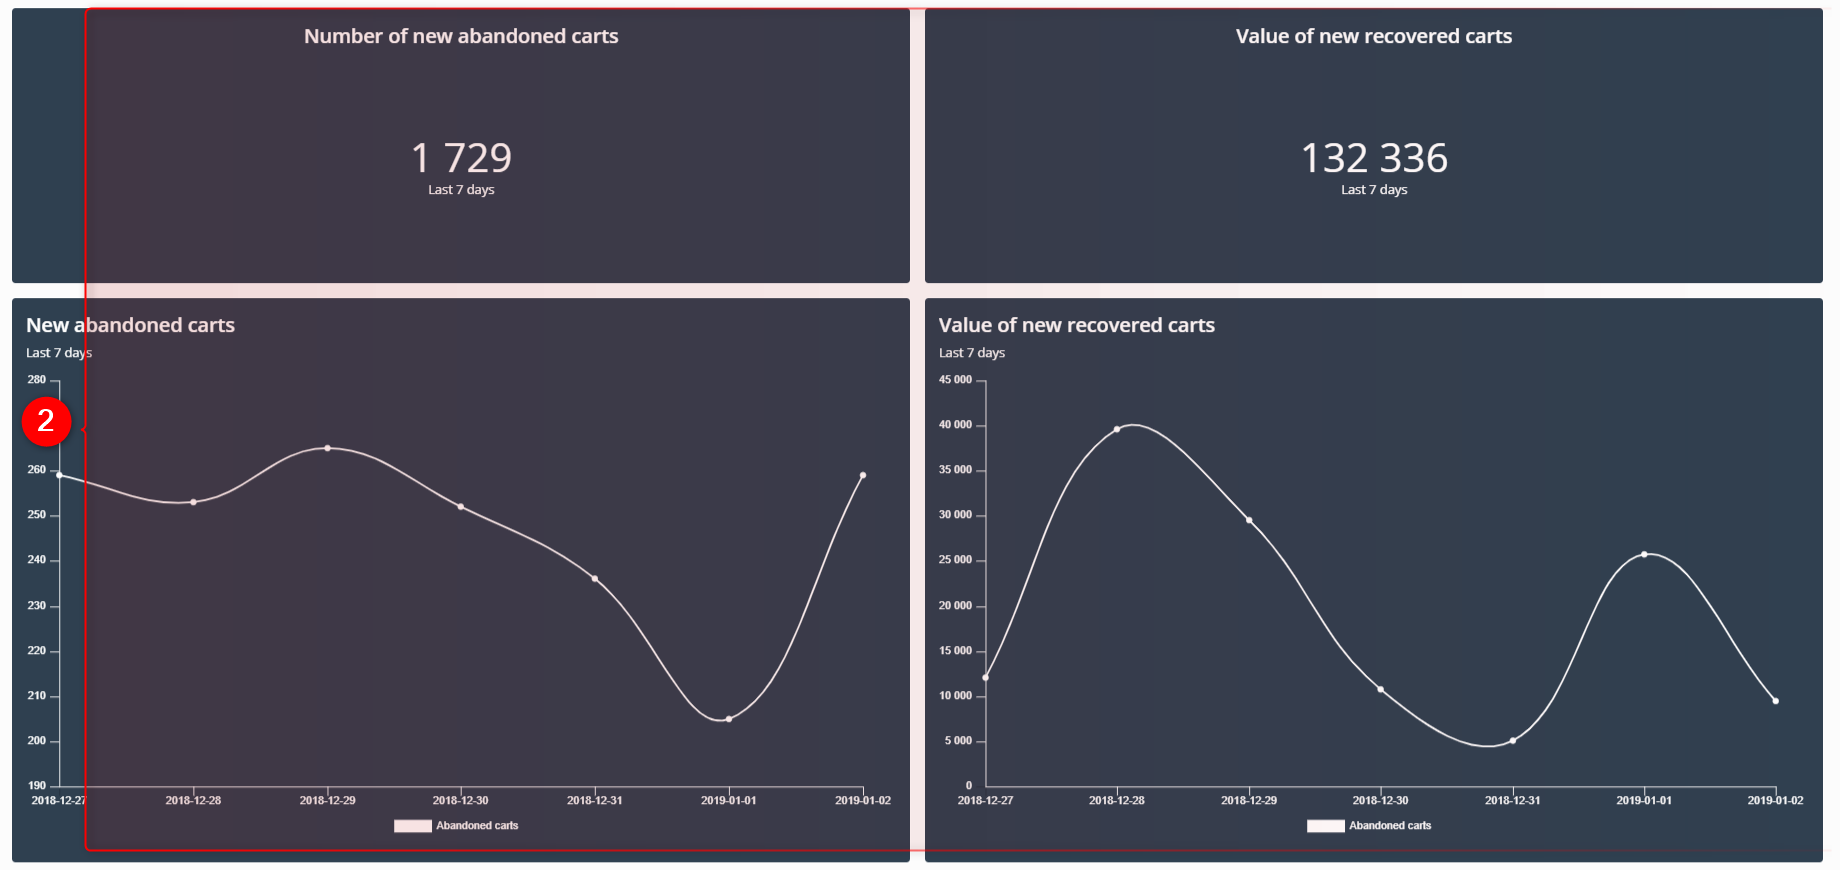
[3] – all widgets used on the sales dashboard have been chosen from the group Transactions which is available in the widget library.
- Number of all transactions – the widget shows the total number of the finished transactions since the beginning of the SALESmanago platform configuration.
- Total value of transactions – the widget shows the full value of all finished transactions since the beginning of the SALESmanago platform configuration.
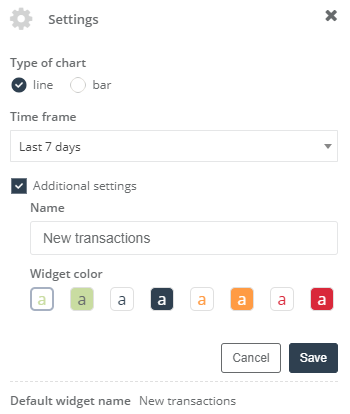
- Transactions with pageviews – the chart that indicates the correlation between transactions and the website traffic at the specific time. In the settings of the widget you can determine the type of the chart, the type of pageviews (monitored, anonymous or mixed), type of transactions (purchases or abandoned carts). Additionally you need to establish which data type you want to display – the number of transactions, value or average / minimum or maximum value of transactions. Additional settings enable the change of color scheme and name of the widget.
2. Editing
[A] Widget editing
To enable the editing of the dashboard, click the Edit button.
![]()
Then hover the cursor of the mouse over any widget, as a consequence, you will be able to see three icons.
IMPORTANT: You can add up to 24 widgets to one dashboard.

[1] Finish editing – the blockade of editing mode.
[2] Widget library – here you can find the widgets that you can add to the dashboard.
You can find more information about the widget library here.
[3] – the option of adding another dashboard. You can add up to 5 personalized dashboards.
[4] – the option of removing the widget from the dashboard. The deleted widget will be still available in the widget library.
[5] – the option of copying the widget.
[6] – widget settings. Depending on the group to which the widget belongs, you can configure the type of displayed data, the time frame, the owner of contacts and the additional settings which are the change of the widget color scheme and the change of the default name.
[7] – the option of adjusting the widget size.
[B] Adjusting the size of the widget
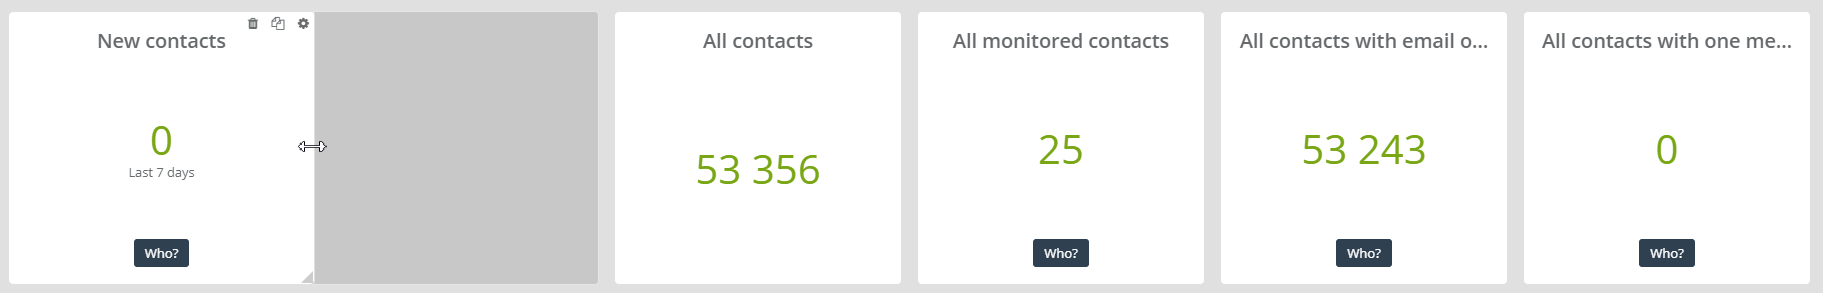
Adjust the size of the widget by hovering the cursor over the edge of the widget. The maximum size the widget can take is highlighted grey color. You can add widgets in three rows and each row can contain up to 6 widgets.
[C] Choosing a place for the widgets on the dashboard

Drag and drop the widget onto the chosen place.
IMPORTANT: To add a widget into a chosen place, you need to prepare a space for it.