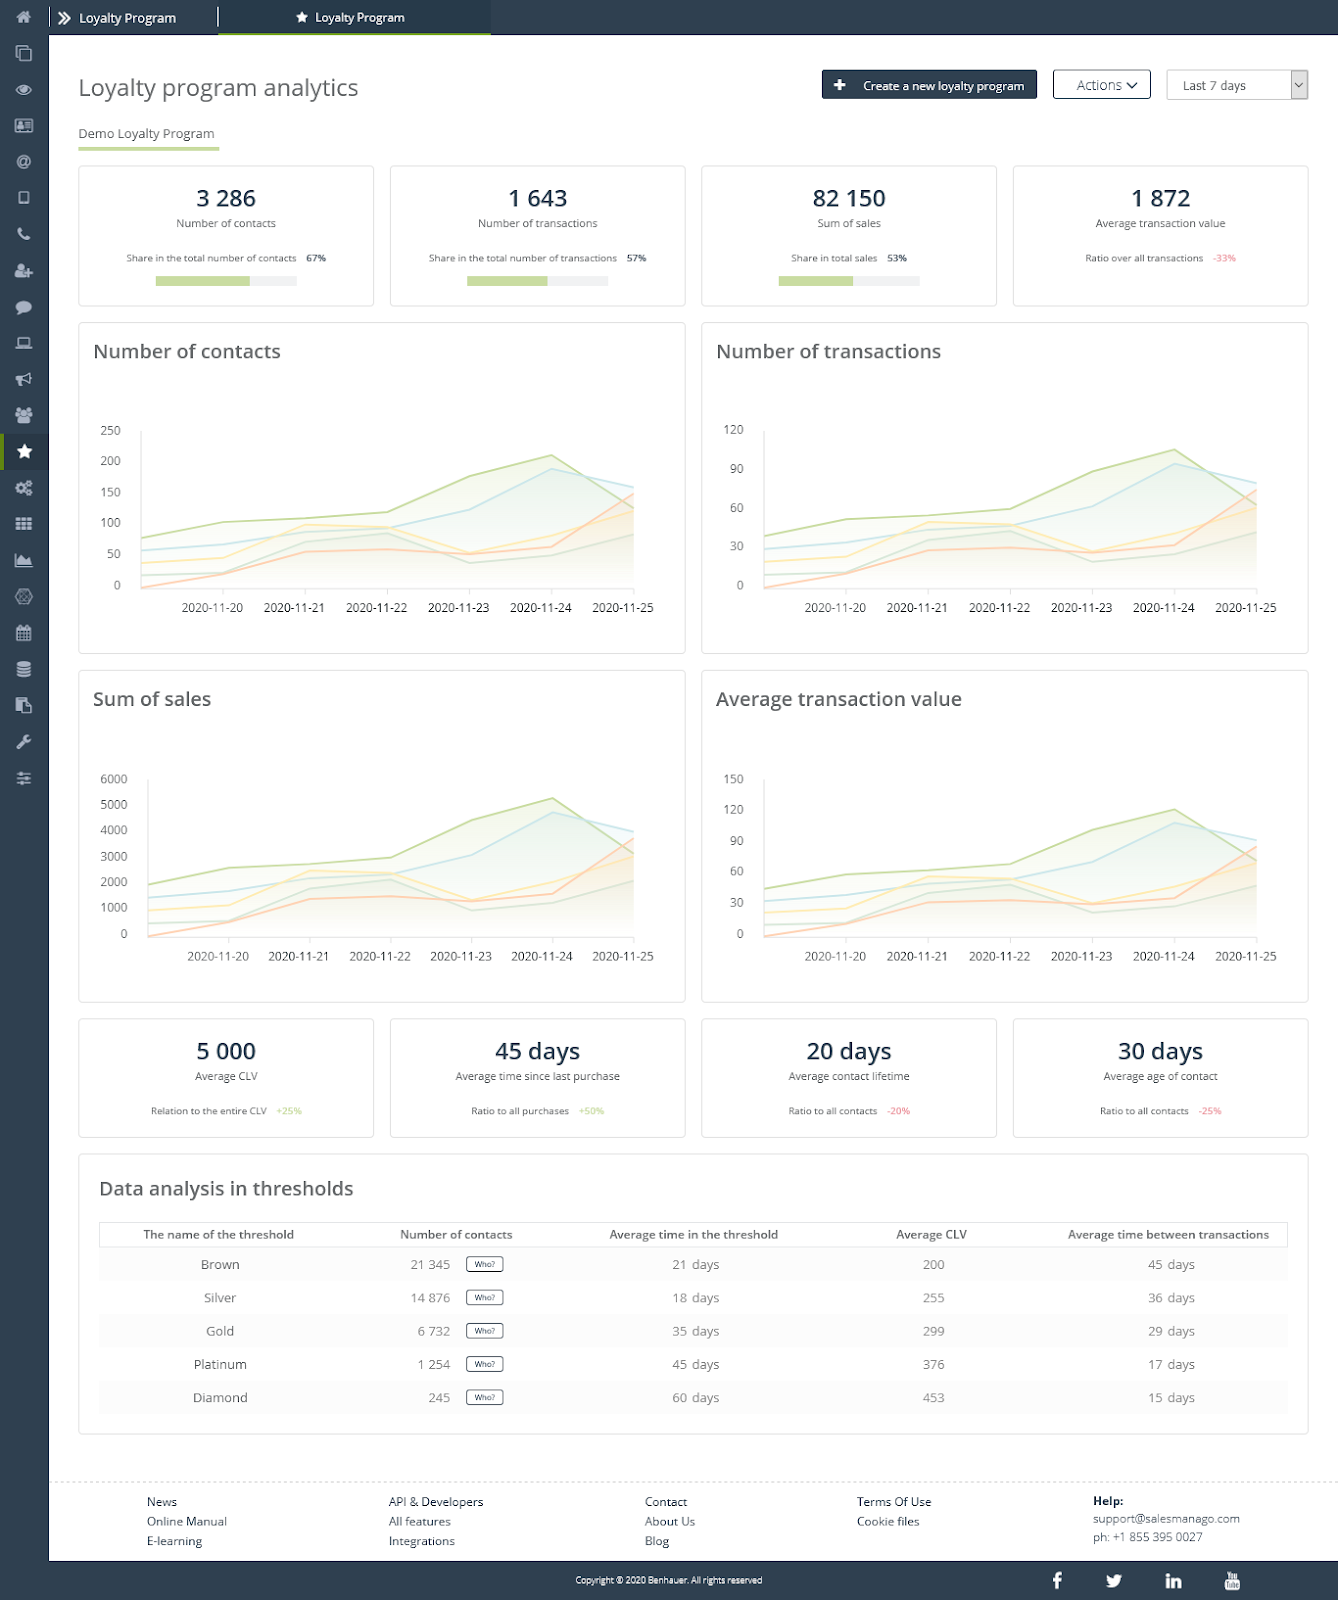
Use the data contained in a separate analytical panel of each created Loyalty Program. Analyze the effectiveness of your Loyalty Program by measuring customer progress at different program tiers and how different customer segments defined in the Loyalty Program affect your overall revenue. Engage and increase your customers’ retention and LTV with highly customizable Loyalty Programs that seamlessly integrate with all CDP data and enable automated, multi-channel communication.
To open Loyalty Program Analytics go to the tab
Audiences → Loyalty Program → individual Loyalty Program
Contents
- Basic information
- Number of contacts
- Number of transactions
- Sum of sales
- Average transaction value
- Average values
- Data analysis in thresholds
1. Basic information
In the Loyalty Program analytics panel you will find basic statistics about the selected program:
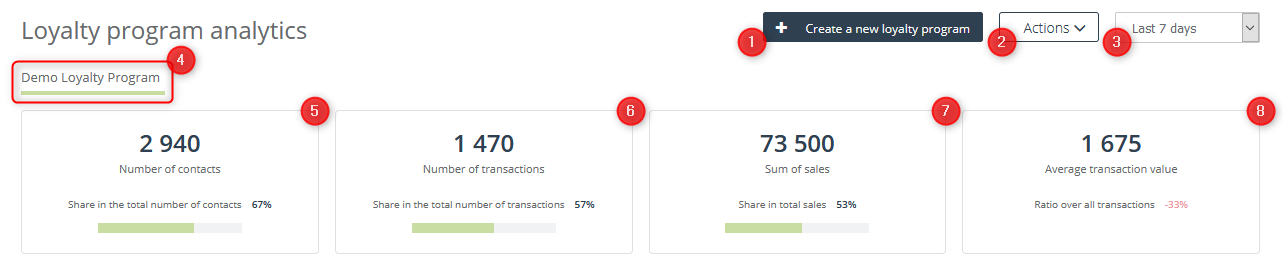
[1] + Create a new Loyalty Program – click the button to proceed to creating and configuring a new Loyalty Program.
See how to create a Loyalty Program >>
[2] Actions – select the action you want to perform on the Loyalty Program selected in step [4]. You can activate / deactivate it, edit it or delete it.
[3] Time period – select the time period for which information will be displayed below – the available options are: last 7 days, last 30 days, current month, previous month, current quarter, previous quarter, current year, previous year, last 12 months.
[4] Choose a Loyalty Program – select the Loyalty Program for which you want to view the analytics by clicking on its name.
IMPORTANT: SALESmanago allows you to have a maximum of three created Loyalty Programs. If you want to create more of them, please contact our customer service department.
[5] Number of contacts – the total number of contacts participating in this Loyalty Program. Below you can also see Share in the total number of contacts, i.e. the percentage of contacts participating in a given Program, in relation to all contacts in your contact database.
[6] Number of transactions – the total number of transactions of users participating in a given Loyalty Program in the store specified during the program configuration. Below you can also see the Share in the total number of transactions, i.e. the percentage of transactions of contacts participating in a given Program in relation to the total transactions of all contacts in your contact database.
[7] Sum of sales – the total amount of transactions of users who participate in a given Loyalty Program, in the store specified during the program configuration. Below you can also see Share in total sales, i.e. the percentage of the total number of transactions of contacts participating in a given Program, in relation to the total sum of transactions of all contacts in your contact database.
[8] Average transaction value – the sum of transactions value, made by users who participate in a given Loyalty Program in the store specified during the program configuration. Below you can also see the Ratio over all transactions, i.e. the percentage of the difference, in the average transactions value of contacts participating in a given Program in relation to the average of the total sum of transactions of all contacts in your contact database.
2. Number of contacts
The Number of contacts tile shows graphically information about the increase or decrease in the number of contacts in the given thresholds, in the selected Loyalty Program.
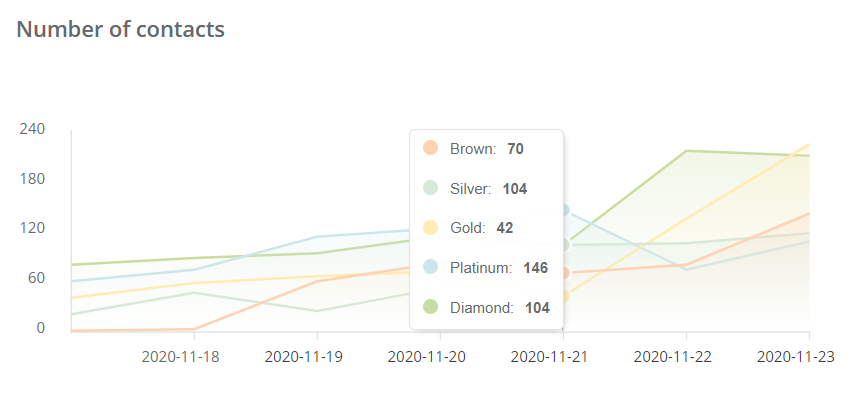
IMPORTANT: The information on the graph above expresses the data for the selected time period and is updated once a day.
3. Number of transactions
The Number of transactions tile shows graphically information about the increase or decrease in the number of transactions made by contacts in the given thresholds, in the selected Loyalty Program.

IMPORTANT: The information on the graph above expresses the data for the selected time period and is updated once a day.
4. Sum of sales
The Sum of sales tile shows graphically information about the increase or decrease in the value of transactions made by contacts in the given thresholds, in the selected Loyalty Program.
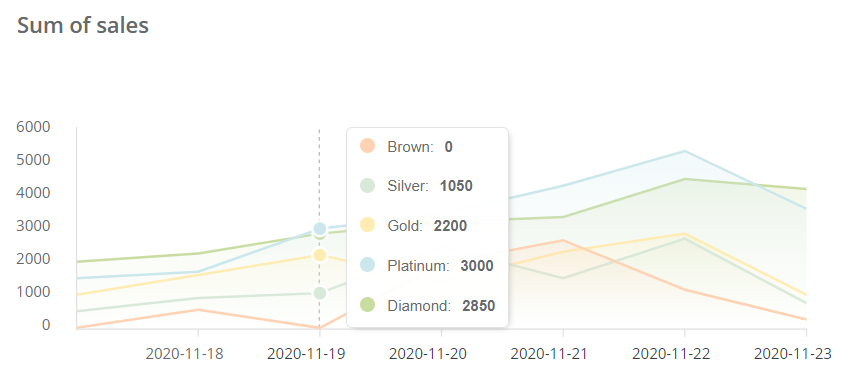
IMPORTANT: The information on the graph above expresses the data for the selected time period and is updated once a day.
5. Average transaction value
The Average transaction value tile shows graphically information about the increase or decrease in the average value of transactions made by contacts in the given thresholds in the selected Loyalty Program.
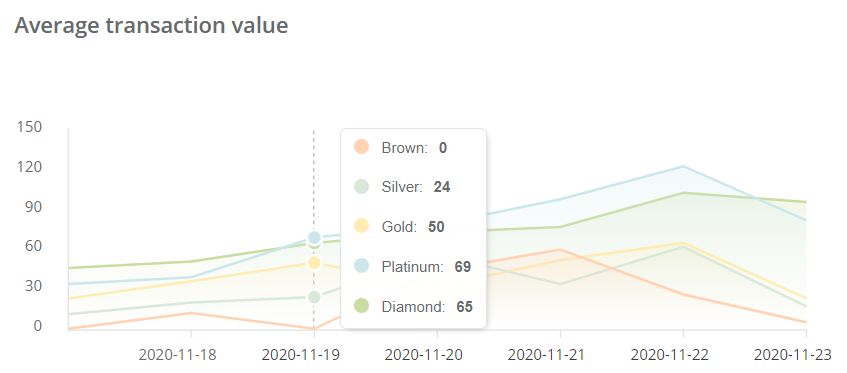
IMPORTANT: The information on the graph above expresses the data for the selected time period and is updated once a day.
6. Average values
Here you can view the average values for a given Loyalty Program, and more precisely:
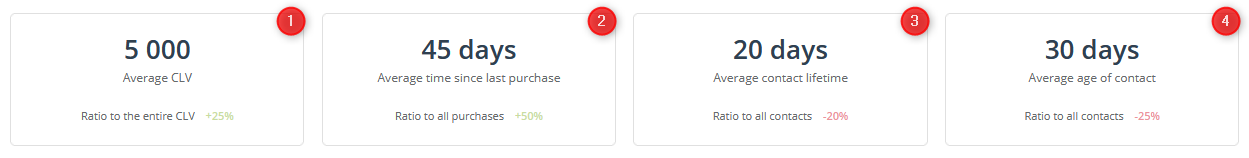
[1] Average CLV – the average sum of the transactions value, made by a contact in a given Loyalty Program. In other words – the total average value of products purchased by a contact. Below there is also the Ratio to the entire CLV, i.e. the difference between the average CLV of a contact from the entire contact base and the average CLV of a contact from the Loyalty Program base.
[2] Average time since last purchase – the average time between transactions made by a contact in a given Loyalty Program. Below, there is also the Ratio to all purchases, i.e. the difference between the average time since the last purchase of a contact from the entire base, and the average time since the last purchase of a contact from the Loyalty Program base.
[3] Average contact lifetime – the average time between the first and last purchase of a contact included in a given Loyalty Program. Ratio to all contacts, i.e. the difference between the average lifetime of a contact from the entire base and the average lifetime of a contact from the Loyalty Program base.
[4] Average age of contact – the average time between first purchase and the present moment. It concerns a contact in a given Loyalty Program. Ratio to all contacts, i.e. the difference between the average age of contact from the entire database and the average age of contact from the Loyalty Program database.
7. Data analysis in thresholds
The last tile in Analytics is Data analysis in thresholds, where you can find information on:

[1] The name of the threshold – the name of the threshold selected in the process of creating a Loyalty Program to which further data will refer.
[2] Number of contacts – the total number of contacts at a given threshold of the Loyalty Program.
[3] Average time in the threshold – the average time that passes between changing contact thresholds in a given Loyalty Program.
[4] Average CLV – the average sum of transactions value, made by a contact within a given threshold, in a selected Loyalty Program.
[5] Average time between transactions – the average time between one transaction and the other, for a contact within a given threshold in the selected Loyalty Program.