Web Push notifications are a vital part of many marketing strategies. Messages consisting of an icon and a short text are a quick and effective way to communicate with your contacts. With SALESmanago’s intuitive wizard, you can easily prepare your own notifications. You can also create your own library of templates, leveraging quick access to saved templates in multilevel automation processes. Sent and scheduled notifications can be found on the Web Push List.
To open the list of Web Push notifications, go to
Web Push → Sent Notifications
Contents
- Basic information
- Web Push List
- List tabs
- List filters
- List customization
- Notification view on the list
- Web Push notification analytics
1. Basic information
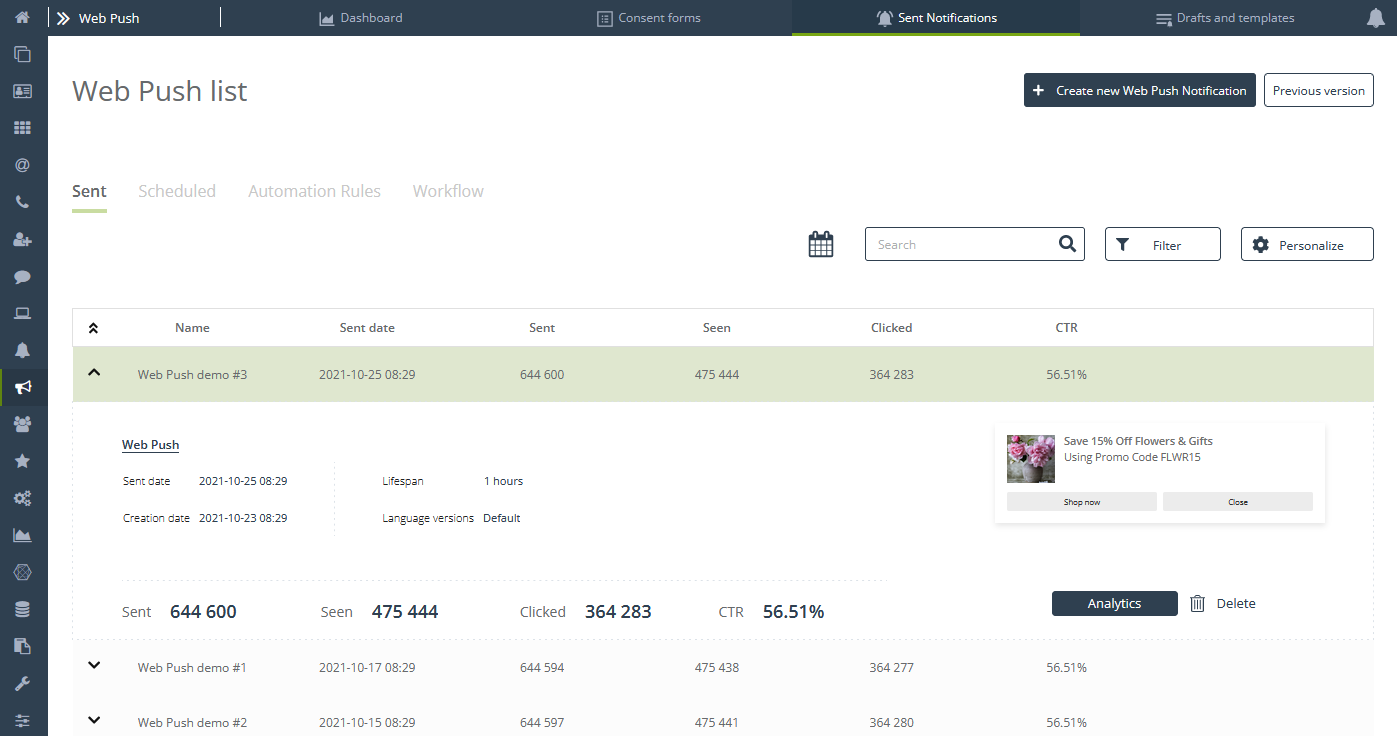
The Web Push Notification Wizard is a simple, intuitive tool that allows you to create effective and attractive Web Push and Rich Web Push notifications in a step-by-step manner. Sent and scheduled messages are collected in the notification list. The list provides quick access to basic statistics while also allowing you to easily switch to analytics for a single Web Push notification.
2. Web Push List
The Web Push List gives you quick access to notifications sent, scheduled to be sent, and sent via automation rules and Workflow. There are quite a few filtering and view customization options for the list. It also allows you to go to the analytics of a specific notification with one click.
IMPORTANT: The bulk analytics of all notifications are available from the Web Push Notification Dashboard.
List tabs
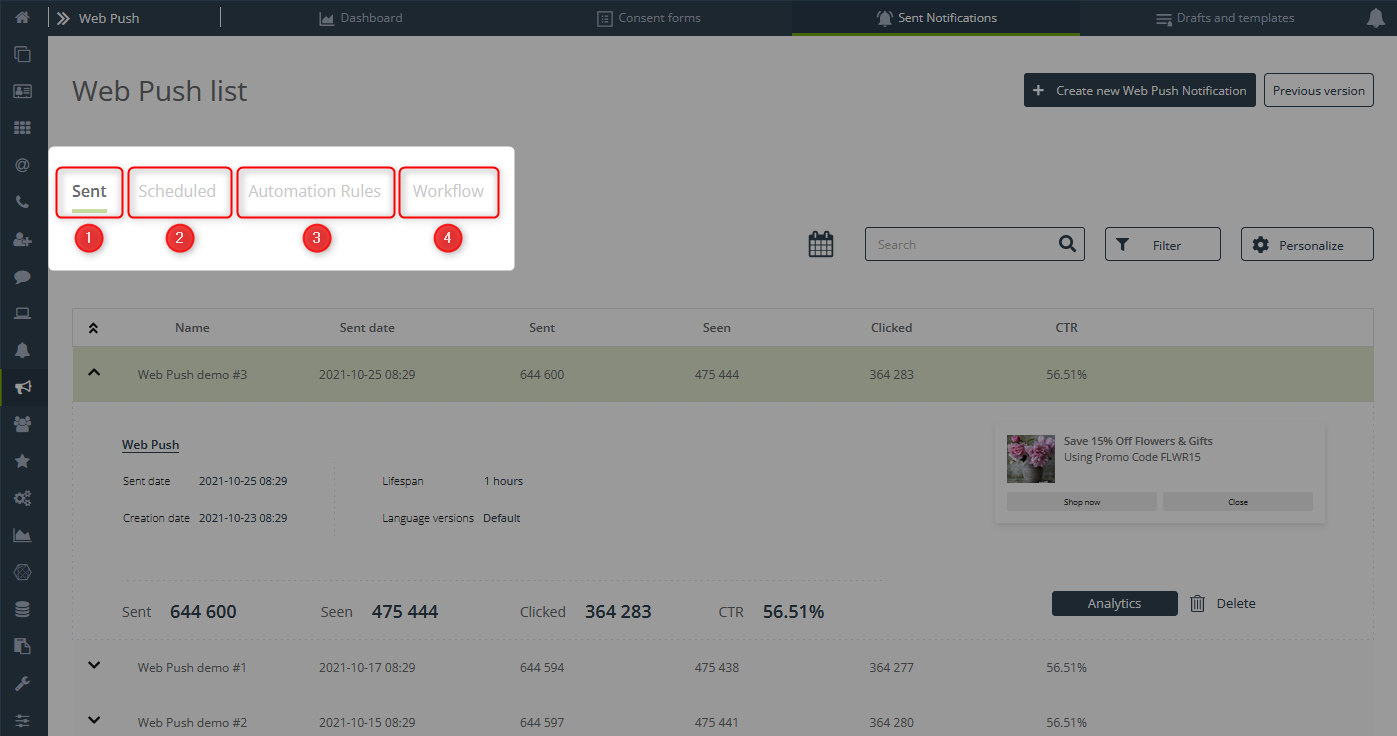
[1] Sent – A list of sent Web Push notifications along with basic information and statistics. The list will include notifications sent using the Save and Send option in the Notification Wizard, as well as those sent from the list of templates and drafts. From this level, you can delete a notification or access its analytics.
Read more about the Static Web Push Notification Wizard >>
Read more about the Dynamic Web Push Notification Wizard >>
Read more about Web Push notification drafts and templates>>
[2] Scheduled – A list of Web Push notifications scheduled to be sent along with basic information. The list will include notifications that were saved using the Save and Send option in the Notification Wizard and scheduled to be sent in the future. You can delete a notification from this tab view.
ATTENTION: Because these notifications have not yet been sent, there will be no performance statistics for the list.
[3] Automation Rules – List of Web Push notifications sent with automation rules, along with basic information and statistics. From this tab, you can access the notification analytics.
[4] Workflow – A list of Web Push notifications sent with Workflow processes, along with the basic information and statistics. From this, you can access the notification analytics.
List filters

1.Time range
This filter allows you to quickly find notifications sent within a specific time range.
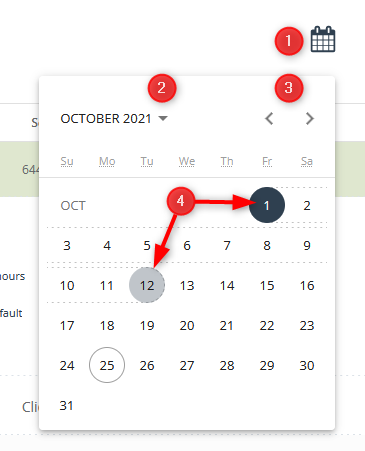
[1] Filter by date – Click the calendar icon to expand the calendar and select a date range.
[2] Year and month – Use the drop-down menu to quickly jump to the time you are interested in. Select the year first and then the month.
[3] Navigate between months – You can also use the arrows to find the date you want.
[4] Date range – Once you have found the start date, click the appropriate date and then hover over the end date and click this date. Doing this will select the date range that will form the basis of this filter.
2.Search
The search option makes it easy to quickly find a notification by typing in its name.
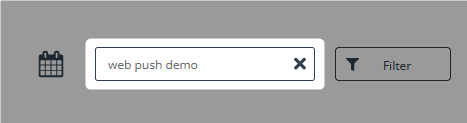
To search for a notification, start by typing its name. After typing three characters, you will notice that the list starts to dynamically match the query.
3.FIlters
The system also enables you to filter messages according to the selected metrics.
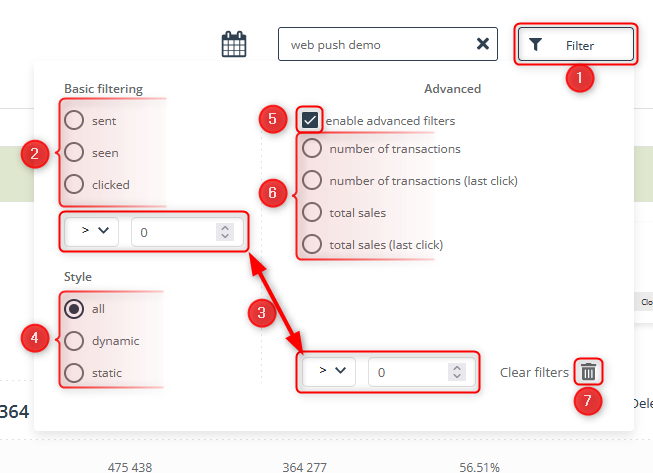
[1] Filter – If you hover over and click on the button, you will see an expanded menu that allows you to select the notification performance indicators you are interested in.
[2] Basic filtering – The basic version of filtering by indicators allows you to select one of three values:
- sent – Filters messages according to the number of sent notifications.
- seen – Filters messages according to the number of displayed notifications.
- clicked – Filters messages according to the number of clicked notifications.
[3] Specifying a value for the selected filter – For a filter to be complete, it also needs you to specify the cut-off value. You can do this by using the following mathematical operators:
- “=” if the value is to be equal to the set number.
- “<” and “>” for a smaller or larger value.
In the box next to it, specify a numeric value.
EXAMPLE: If you want to find messages that were less effective than others, check the average notification click-through rate on your dashboard. Then, go to the list and filter out all the messages that have a click-through rate below the average value. By analyzing these notifications and comparing them with the best-performing ones, you will be able to create more effective and converting notifications.
[4] Style – In the basic version of filtering by style, you can select one of three values:
- all – Shows all messages.
- dynamic – Shows only dynamic Web Push notifications.
- static – Shows only static Web Push notifications.
[5] Enable advanced filters – Check this box if you want to go to advanced filtering.
[6] Filter selection – In the advanced version, you can filter notifications according to the following metrics:
4. number of transactions – Takes into account the number of transactions supported by a selected notification (in general).
5. number of transactions (last click) – Takes into account the number of transactions supported by a selected notification (based on the last click).
6. total sales – Takes into account the total number of sales supported by a selected notification (in general).
7. total sales (last click) – Takes into account the total sales supported by the selected notification (based on the last click).
[7] Clear filters – If you don’t want to save the selected filters, you can click the trashcan icon to delete the entered filters.
4,Deleting filters
Filtering can be modified at will.
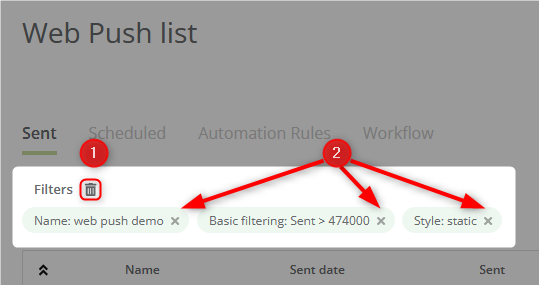
[1] Delete all filters – By clicking the trashcan icon, you can quickly delete all the filters you have entered.
[2] Delete filter – Filters can also be deleted individually. If you want to remove a single filter from the list, click the “x” in the box next to the filter name.
List customization
You can customize the columns in the notification list at any time to better suit your preferences.
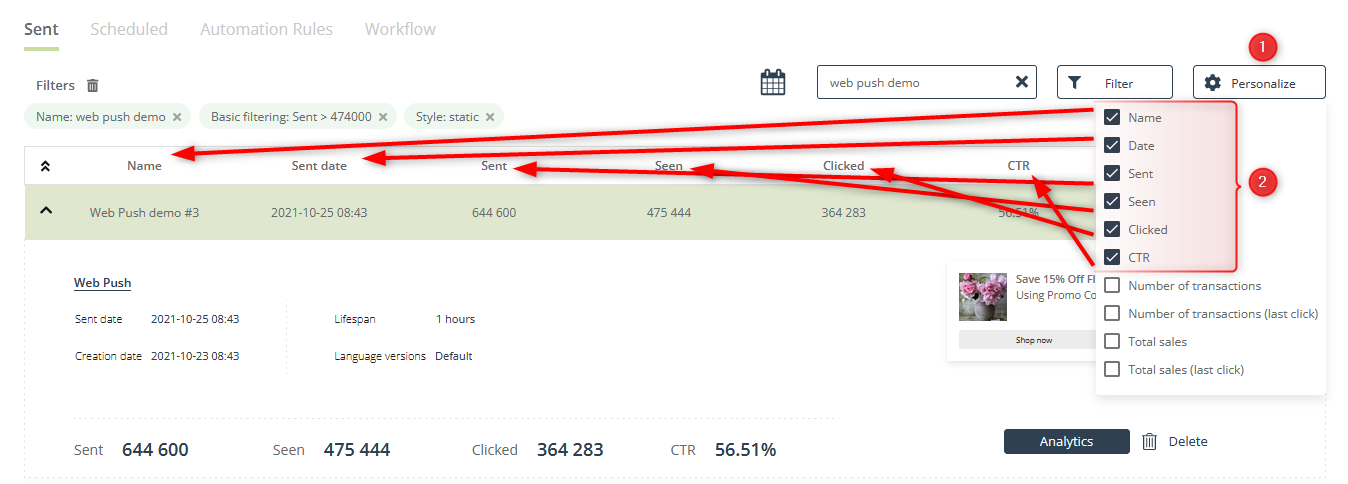
[1] Personalize – Click the button to expand the menu.
[2] Select columns – Select which columns you want to be visible on the list. The choices are as follows:
- Name – The name specified when creating the notification.
- Date – Date when the notification was sent.
- Sent – The number of sent notifications.
- Seen – The number of displayed notifications.
- Clicked – The number of clicked notifications.
- CTR – Click-through rate of notifications, here expressed as a percentage.
- Number of transactions – The number of transactions supported by the selected notification (total).
- Number of transactions (last click) – The number of transactions supported by the selected notification (as a last click).
- Total sales – The number of transactions supported by the selected notification (in general).
- Sum of sales (last click) – Number of transactions supported by the selected notification (as a last click).
Notification view on the list
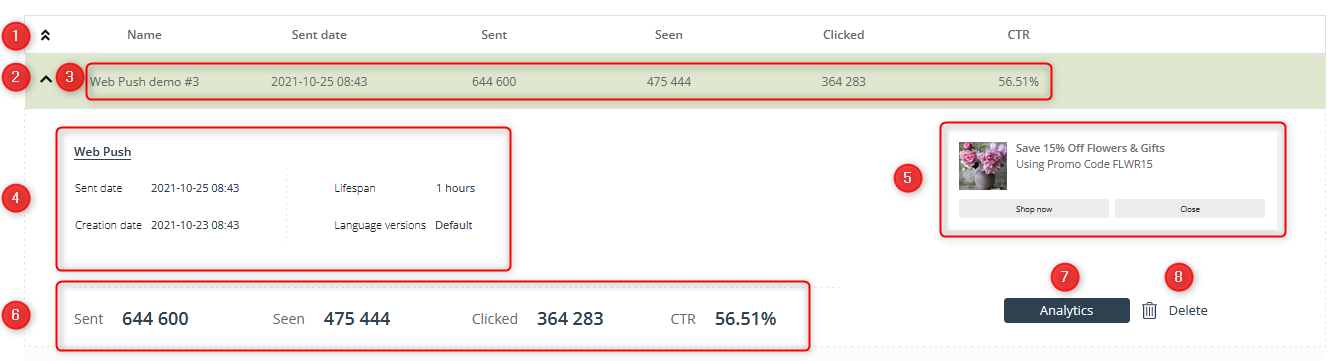
[1] Collapse/expand the view of all notifications – Use the double arrow to collapse or expand the view of all the notifications on the list.
[2] Collapse view of a single notification – Use the single arrow to collapse or expand the view of a selected notification on the list.
[3] Selected statistics – A quick overview of the statistics for the values selected in the Personalize menu. These statistics are the only ones that are also visible when the notification view is collapsed.
IMPORTANT: For the “Scheduled” list tab, the system does not display any statistics. This is because the notification has not been sent yet.
[4] Basic Information – Information about the sending date, creation date, notification lifespan, and its language versions.
[5] Notification preview – A general preview of the sent/scheduled notification.
[6] Key metrics – Information about the number of notifications sent, seen, and clicked, as well as the CTR of the selected notification.
IMPORTANT: For the “Scheduled” list tab, the system does not display any statistics. This is because the notification has not been sent yet.
[7] Analytics – Button that allows you to go to the detailed analytics of the selected notification.
[8] Delete – Button that allows you to delete the selected notification. The button works only for the “Sent” and “Scheduled” tabs.
3. Web Push Notification Analytics
Clicking on the Analytics button in the list of notifications automatically takes you to the analytics section of the selected notification.

[1] Name – The name specified when creating the notification along with the type of notification (Web Push notification/dynamic Web Push).
[2] Basic information – Information about the sending date, creation date, notification lifespan, and its language versions.
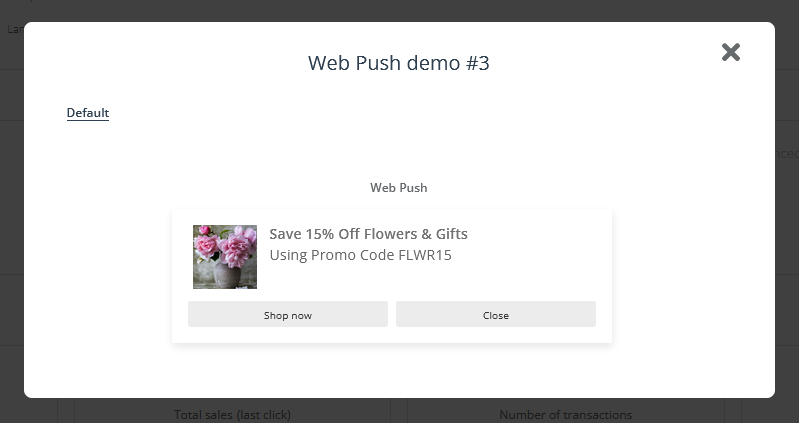
[3] Notification preview – General preview of the sent/scheduled notification. Clicking the button opens a window with the default notification preview.
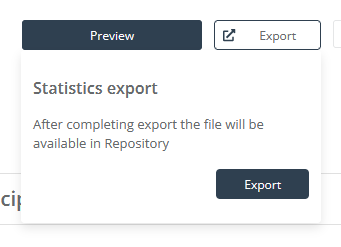
[4] Export – Clicking the button opens a window with information that the exported files will be found in the Repository. After you confirm the request using the Export button, the system will start exporting the notification analytics data.
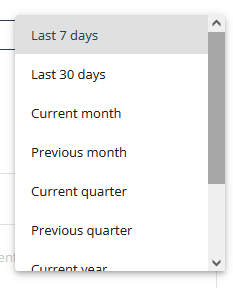
[5] Analytics time range – You can select what time range of notification performance you want to analyze. Select the option you are interested in from the drop-down menu.
[6] Consent and recipient group – Information about the group to which the notification was sent.
[A] Group of recipients – Detailed information about the selectors and filters used in the dispatch, broken down into selected contacts, excluded contacts, and advanced criteria.
[7] Sales analytics – Data on the impact of a given notification on sales, as follows:
- Total sales – The number of transactions supported by a selected notification (in general) along with the indication of its share of the total sales in the store.
- Total sales (last click) – Number of transactions supported by the selected notification (last click), along with the indication of its share of the total sales in the store.
- Number of transactions – Number of transactions supported by a selected notification (in general), along with the indication of its share of the total sales in the store.
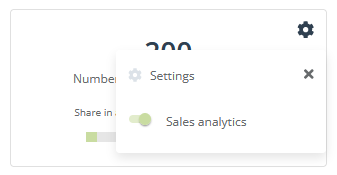
- Number of transactions (last click) – Number of transactions supported by the selected notification (last click), along with the indication of its share of the total sales in the store. On this tile, there is also an option to disable the sales analytics view [A]. To use it, click the gear icon and move the slider to the appropriate position.
Notifications sent – The number of notifications sent.
Notifications seen – The number of notifications displayed, broken down by type (Web Push and Rich Web Push).
Notifications clicked – The number of notifications clicked, broken down by type (Web Push and Rich Web Push), which is followed by the notification CTR.
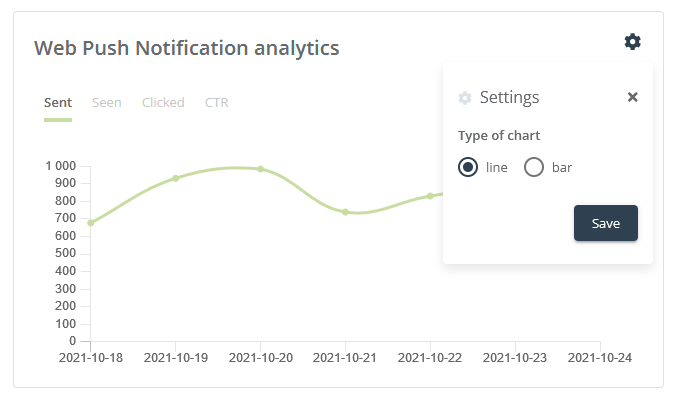
Web Push Notification Analytics Chart – A graphical representation of the analytics of the selected notification.
[B] Analytics by selected metrics – In the chart, you have the ability to seamlessly switch the view depending on the performance metric you are interested in (sent, seen, clicked, and CTR).
[C] Change chart type – You can also go into the chart settings and change the type from line to bar or vice versa.
[8] Detailed statistics – This gives an overview of the notification statistics. Here, you can check the views, clicks, and CTR depending on the device, operating system, and browser used by your subscribers. You can also check a graph visualizing the share of each option in the entire sending. What’s more, if you hover over the bar, you will see a window showing the statistics.
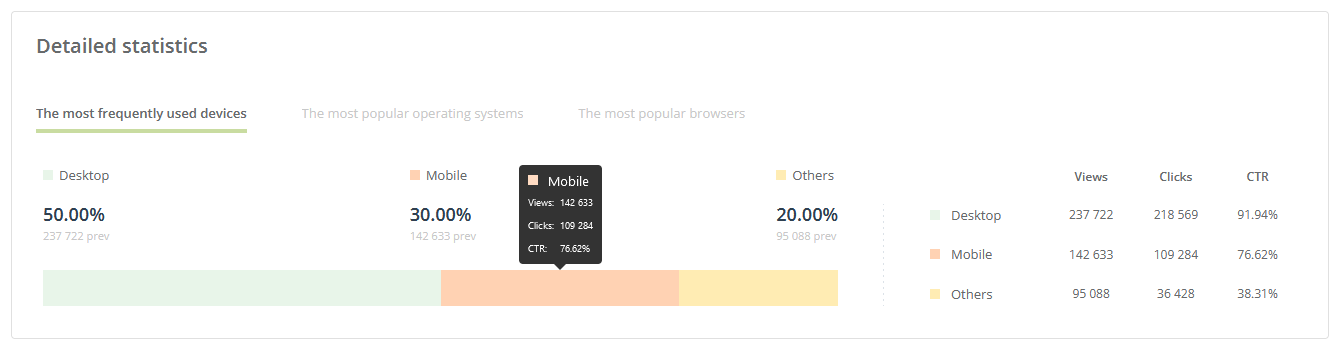
[A] Switching between views – You can switch views on the chart to analyze the following:
- The most frequently used devices.
- The most popular operating systems.
- The most popular browsers.
[9] List of clicked links – The list contains all the links attached to the notification, along with the statistics (clicks and CTR).
[A] List of those who clicked on the link – Next to each link on the list, there is a Who button. When clicked, it will take you to the list of contacts who clicked on the link.