Read more about the new Mobile Push channel >>
To go to Push analytics click Analytics -> Push Notifications.
On the first screen, we have access to global analytics – all messages sent in a given period of time for android, ios, or both systems.
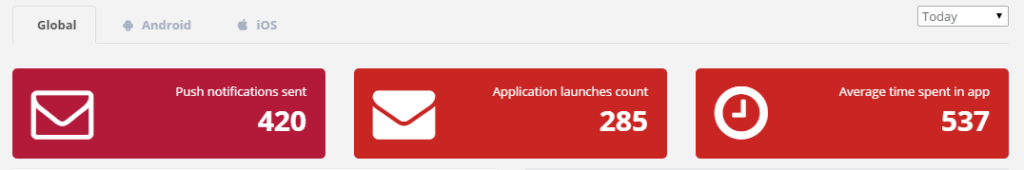
We can choose the period of time for the display analytic: today, this week, last week, this month and last month.
Push notifications sent – number of all sent push messages.
Application launches count – number of application launches.
Average time spent in app – the time that the average user spends in the application in seconds.
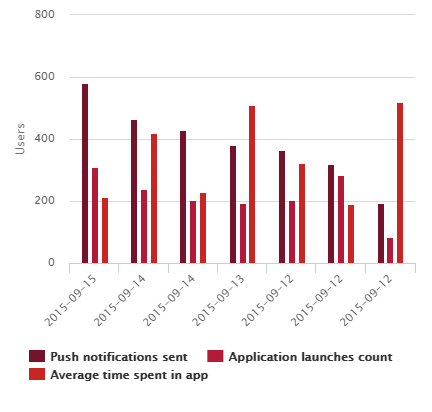
The chart shows the relationship between the amount of sent push, the number of opening applications, and the average time spent in the application.
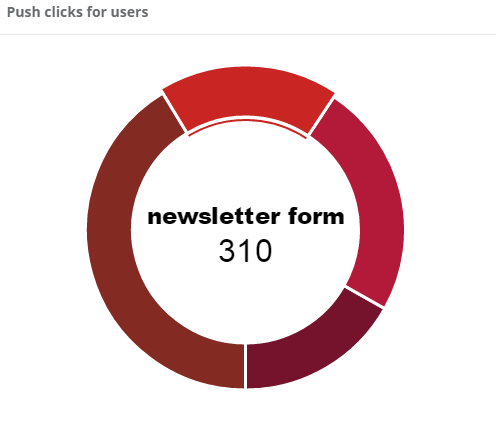
Push clicks for users – the chart shows the number of a clicked push messages.
In the table, we see all sent push messages.
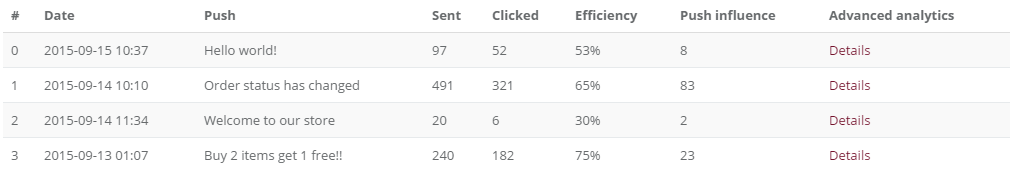
Date – informs when the push was sent.
Push – the name of our push messages.
Sent – number of sent push messages.
Clicked – number of a clicked push messages.
Efficiency – the amount of clicked push messages in relation to sent push messages.
Push influence – the number of application launches in the 24 hours after the push, minus the average number of launch if we don’t send push message.
Advanced analytics – by clicking the details, we go to advanced analytics for a specific push message.
After entering the advanced analytics of push messages again we see a summary of the amount sent, clicked, effectiveness, and impact of push and additional information.
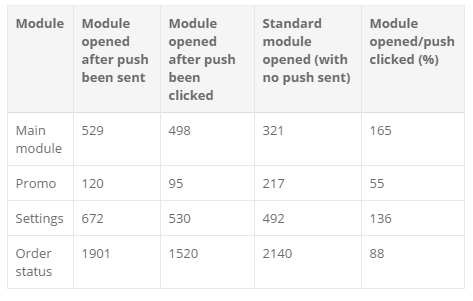
The table presents statistics of modules used after sending a push message
Module opened after push been sent – shows how many users opened module after push message has been sent.
Module opened after push been clicked – shows how many users opened module after push message has been clicked.
Standard module opened (with no push sent) – shows how many users normally opens the module (without sent of the push messages)
Module opened/push clicked (%) – presents the percentage of people who have visited a particular module after clicking on the push message.
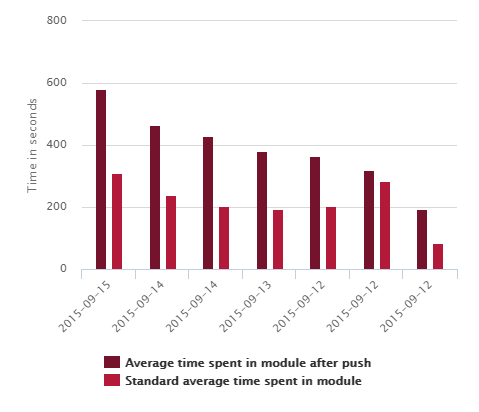
The graph shows the time spent in the application modules after push compared to the standard time spent in the application modules.
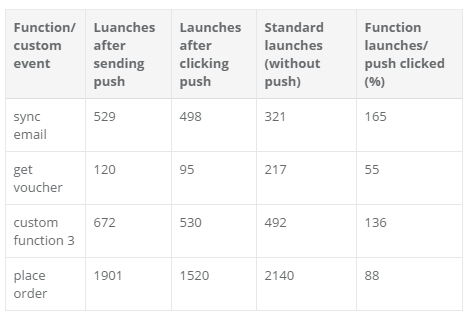
The table presents statistics of function or custom event usage after sending of a push message.
Launches after sending push – shows how many users launched function after push message sent.
Launches after clicking push – shows how many users launched function after push message clicked.
Standard launches (without push) – shows how many users normally use the function (without sent of the push messages)
Function launches/ push clicked (%) – It presents the percentage of people who used the function after clicking on the push message.
The number of calls to a predefined function of purchase after sending Push.
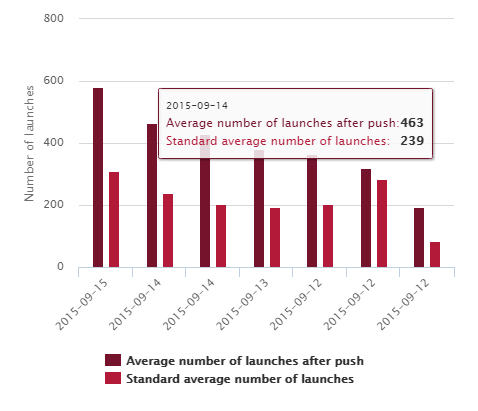
The graph shows the mean number of function launch after the push sent compared to the standard amount of function launch.

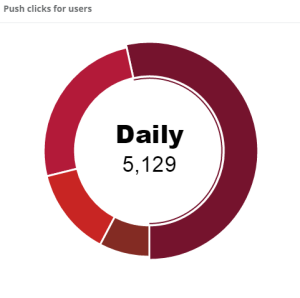
Graphs show number of push opening for groups of users: daily, weekly, monthly, less often.