Product recommendation frames are the most modern tool enabling full personalization of the offer presented in your online store, for both monitored and anonymous users, using its own unique technology to place frames on the website.
- A dedicated CMS to manage the recommendation frames in your store from the system level, designed in such a way that no IT support is needed.
- Advanced creator for responsive frames of any layout and appearance, enabling the addition of any automatic recommendation scenarios including AI mechanisms and live frame preview on the page.
- The ability to place any number of frames adapted to the various stages of the customer’s buying process (product page, product list, checkout).
- Complete analytics of revenues, displays, and clicks generated by each frame.
Benefits:
- You can check analytics for each recommendation frame
- You can check both basic information about your recommendation frames (such as name, creation date, product feed), as well as more advanced data concerning the number of openings and clicks
In order to go to the Analytics of your recommendation frame, go to:
Web Tools → Website Personalization → Recommendation frames → Analytics
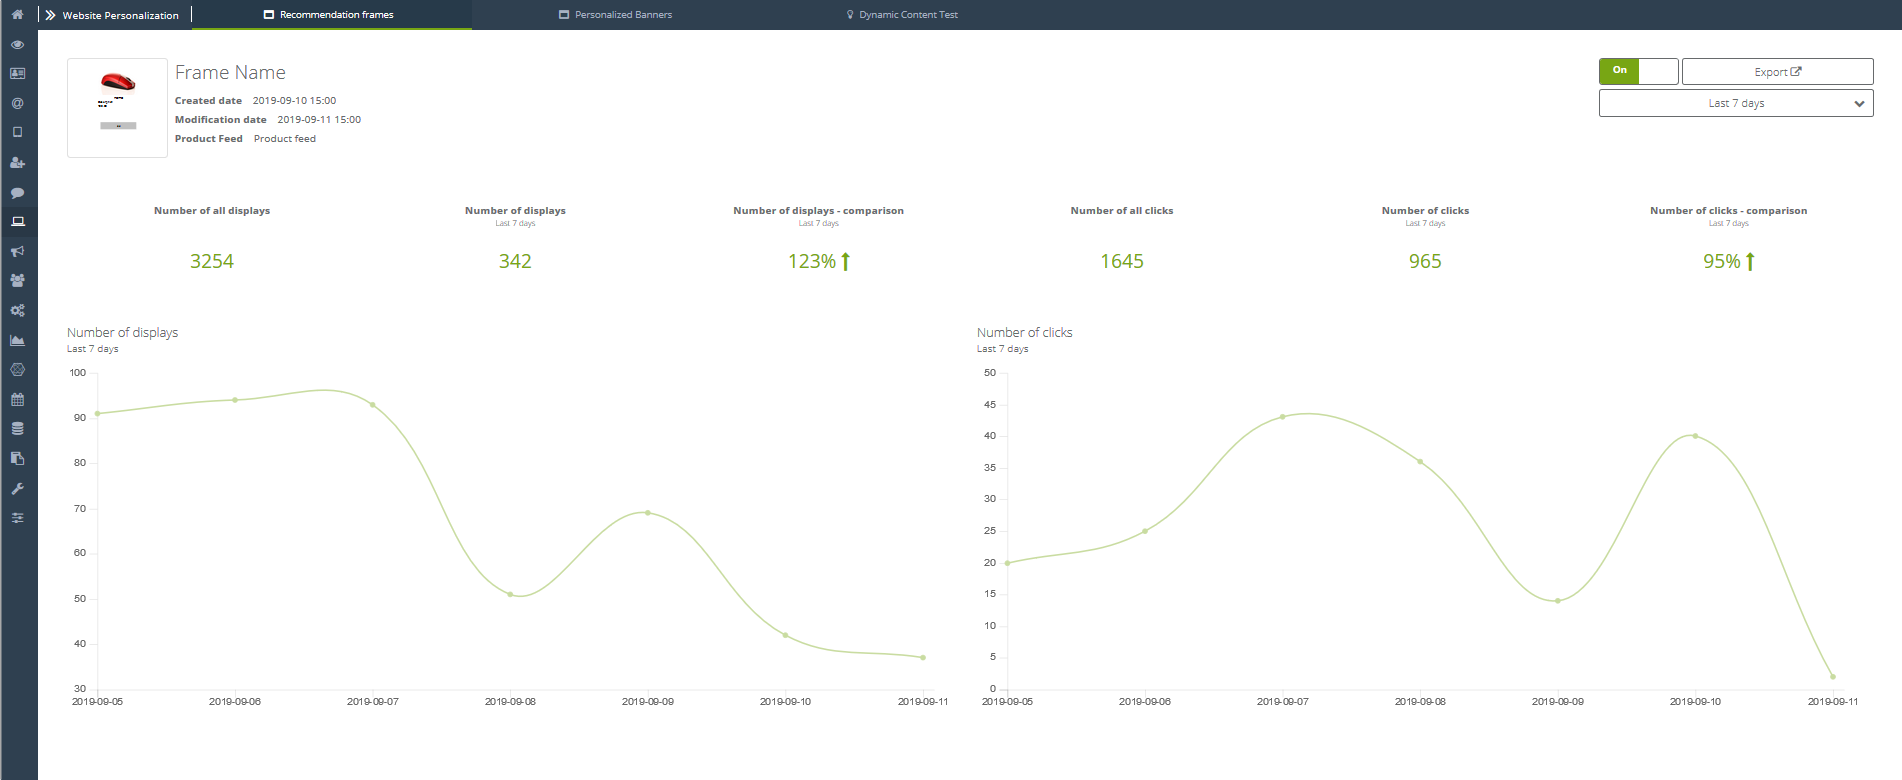
RECOMMENDATION FRAMES ANALYTICS:
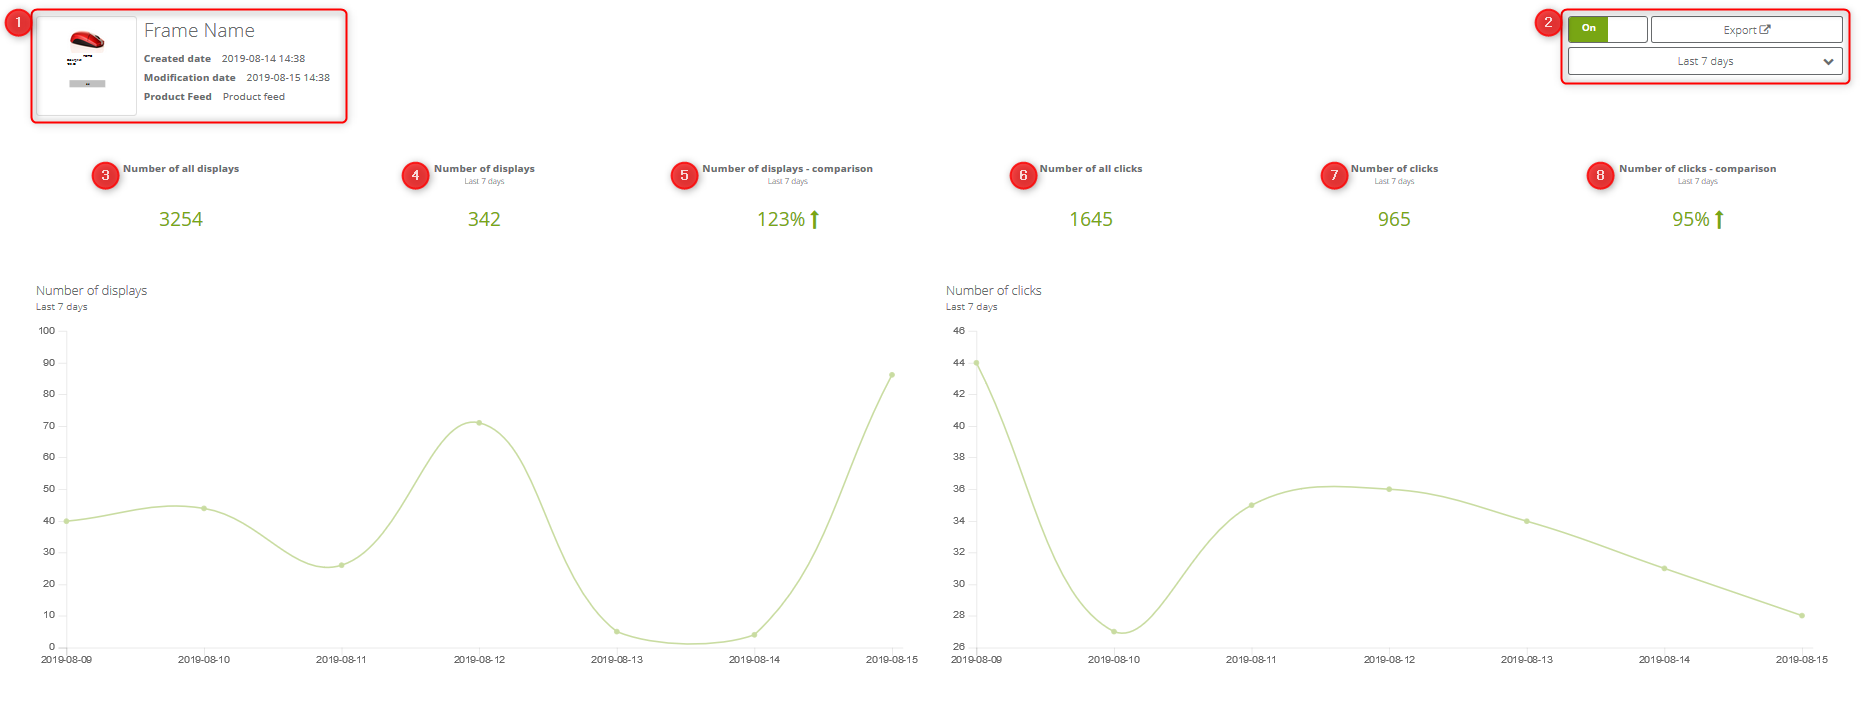
Here you can find as follows:
[1] Basic information on the frame (name, creation date, modification date, product feed) and the Preview
[2] Analytics
- Status (ON – the frame is active, OFF – the frame is not active)
- Export – when you click it, you export data in Excel file
- Time range – here you select the time period from the following options: last 7 days, last 30 days, current month, previous month, current quarter, previous quarter, current year, previous year, last month.
- [3] Number of all displays – how many times the frame has been displayed to all users to whom it was displayed
- [4] Number of displays – how many times the frame has been displayed in the specified time period to all users to whom it was displayed
- [5] Number of all displays – comparison – comparison of displays number in the specified time period (e.g. 7 days) and displays the number on the same, but previous, time period (7 days in this particular case)
- [6] Number of all clicks – how many times the products presented in the frame were clicked
- [7] Number of clicks – how many times the products presented in the frame were clicked in the specified time period.
- [8] Number of clicks – comparison – comparison of clicks number in products presented in the frame in the specified time period (e.g. 7 days) and clicks number in the same, but previous, time period (7 days in this particular case)
Both Number of displays and Number of clicks are displayed in the linear charts.
IMPORTANT:
- Analytics concerns monitored non-monitored and anonymous contacts.
- For data, you can select the time frame. Possible options: last 7 days, last 30 days, current month, previous month, current quarter, previous quarter, current year, previous year, last 12 months.
- In the Analytics you can also activate/deactivate a recommendation frame as well as export the data.
If you need more information about the topic mentioned above, please contact us:
support@salesmanago.com
+1 800 960 0640