Our new Website Marketing main dashboard gives easy access to the most important information about its functions. To view a main dashboard go to Lead Generation -> Website Marketing ->> Dashboard.
If you click that tab you will see the following screen:
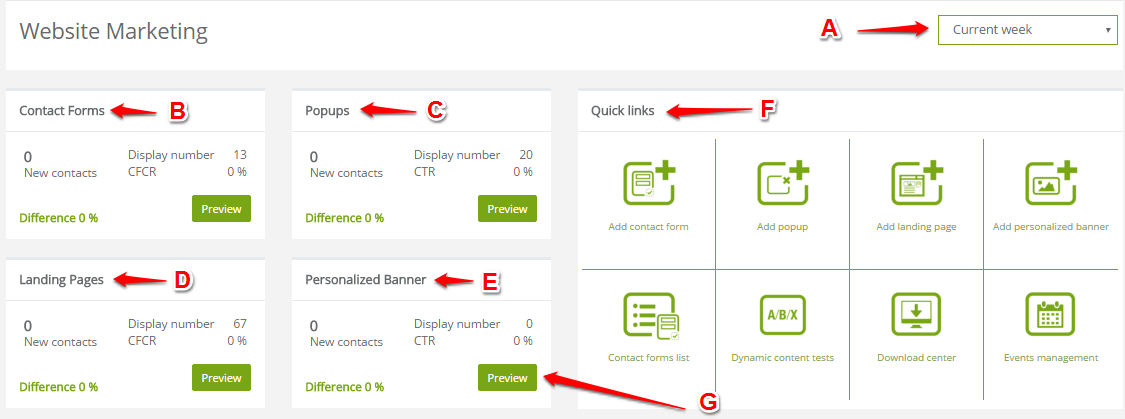
[A] Time slot – choose the time period for which you wish to see the data below – options available: current week, previous week, current month, previous month, current quarter, current year.
[B] Contact forms – here you can find the number of the displays, CFCR (Contact Form Conversion Rate) and the number of the new contacts in terms of contact forms available in your database. Difference – the ratio that show the difference between the last period to the one that you chosen. The ratio is expressed in percentage.
[C] Pop-ups – here you can find the number of the displays, CTR and the number of the new contacts in terms of pop-ups in your website. Difference – the ratio that show the difference between the last period to the one that you chosen. The ratio is expressed in percentage.
[D] Landing pages – here you can find the number of the displays, CFCR (Contact Form Conversion Rate) and the number of the new contacts in terms of landing pages in your system. Difference – the ratio that show the difference between the last period to the one that you chosen. The ratio is expressed in percentage.
[E] Personalized banner – here you can find the number of the displays, CTR and the number of the new contacts in terms of personalized banner. Difference – the ratio that show the difference between the last period to the one that you chosen. The ratio is expressed in percentage.
NOTE: CFCR (Contact Form Conversion Rate) this is the ratio of the new contacts to the number of views, expressed in percentage.
[F] Quick links – click on a icon to be automatically redirected to that tab.
[G] Preview – click „preview” to display the diagram for the chosen data.
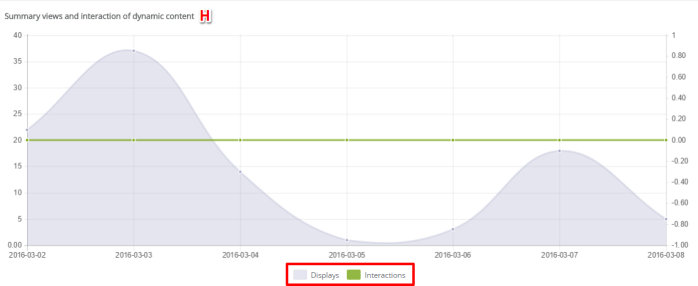
If you click on a Preview [G] then on a diagram [H] the data for a particular window described above (points B-F) will appear.
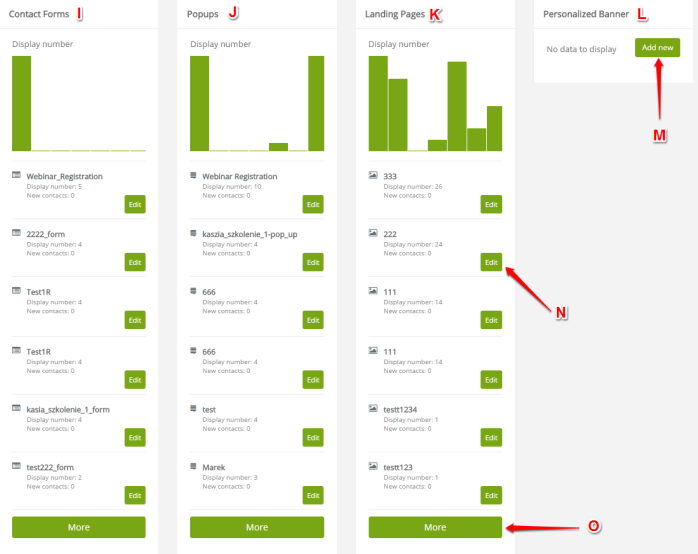
[I] Contact Forms – below you will find the chart with columns that present the number of displays of the contact forms for a chosen time slot [A].
[J] Popups – below you will find the chart with columns that present the number of displays of the pop-ups for a chosen time slot [A].
[K] Landing pages – below you will find the chart with columns that present the number of displays of the landing pages for a chosen time slot [A].
[L] Personalized banner – below you will find the chart with columns that present the number of displays of the personalized banner for a chosen time slot [A].
[M] Add new – if you want to add a new element to the list, to be displayed below the columns, click “add new”. NOTE: the option to “add new” is provided not only for personalized banners but for contact forms, landing pages and pop-ups as well.
[N] Edit – click here and you will be redirected to the edition of a particular element.
[O] More – if you click this button, the list of elements will be presented, for example contact forms.
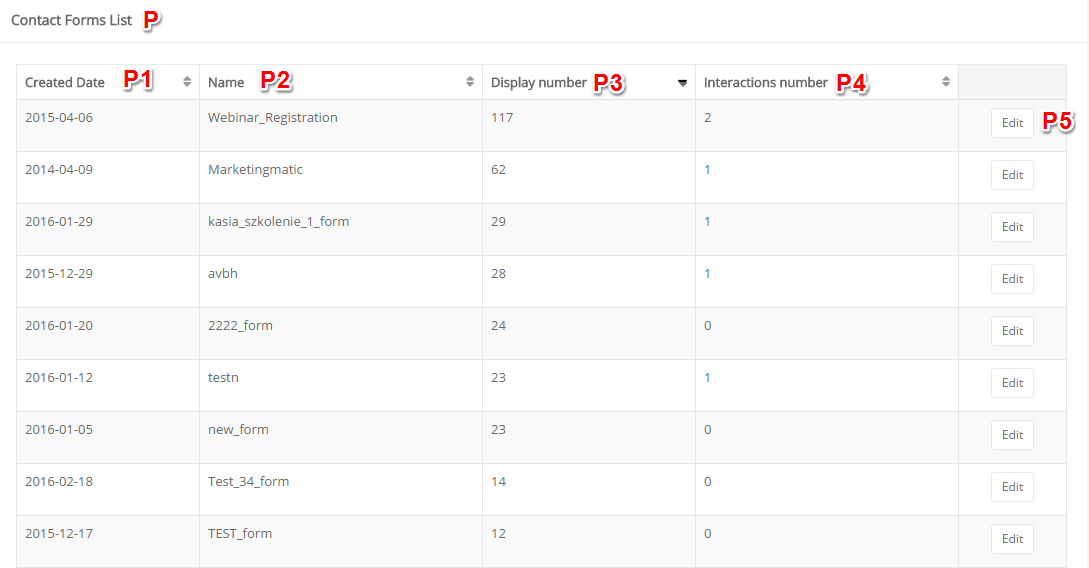
[P] Here, the list of elements that we chose to click on “more” button, will be displayed.
[P1] Created date – day, the element has been created.
[P2] Name – the name of the element.
[P3] Display number – the number of displays of the particular element.
[P4] Interactions number – the number of the interactions.
[P5] Click “edit” and you will be redirected to the edition screen on a particular element.