Personal Shopping Inbox is a new marketing communication channel and tool for collecting zero- and first-party data that supports various activities on your website. The data collected through this widget is sent to the Customer Data Platform. Once the data is there, you can use it to automate and personalize your marketing efforts. In order for these activities to be as effective as possible, you have to analyze them on an ongoing basis. Personal Shopping Inbox analytics allows you to systematically control the effectiveness of marketing activities in this channel and optimize them if necessary.

To open the Personal Shopping Inbox dashboard, go to
Channels → Personal Shopping Inbox → Dashboard → individual Personal Shopping Inbox
Contents
1. Basic information
2. Personal Shopping Inbox Analytics
3. Notification Analytics
4. Product Analytics
1. Basic information
The Personal Shopping Inbox dashboard is a complex analytics panel that gives you a convenient, visual overview of channel performance metrics. The dashboard displays separate analytics for each Personal Shopping Inbox created. This is to maintain the transparency and reliability of the displayed statistics.
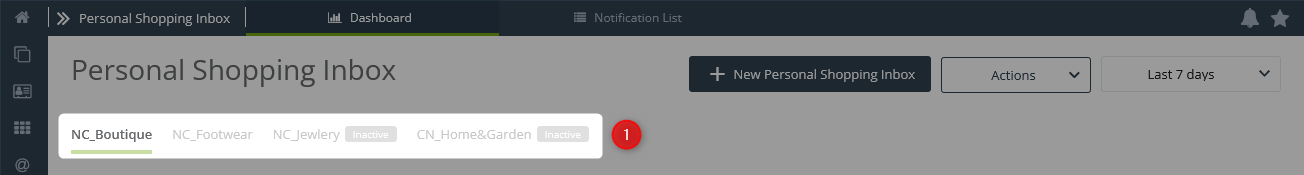
To access the analytics of a specific Personal Shopping Inbox, click its name on the list [1] visible below the Dashboard name.
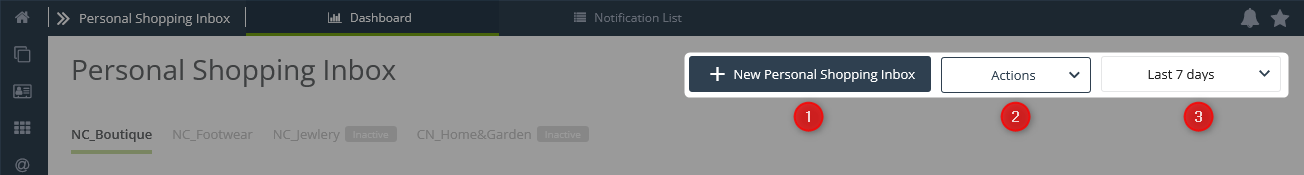
On the Dashboard, you’ll find analytics for the widget itself, notifications analytics, as well as analytics for consent forms. For added convenience, from the Dashboard you can also simply go to the Personal Shopping Inbox wizard [1], perform an action [2], and change the analytics time range [3].
[1] New Personal Shopping Inbox—Go to the wizard.
Learn how to use the Personal Shopping Inbox notification wizard >>
[2] Actions—Select the desired action from the drop-down menu.
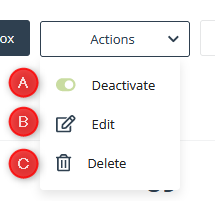
[A] Activate/Deactivate—Changes the status of your Personal Shopping Inbox.
[B] Edit—Redirects to the wizard, where you can change the settings for the selected Personal Shopping Inbox.
[C] Delete—Permanently deletes the selected Personal Shopping Inbox.
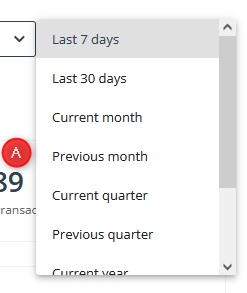
[3] Analytics time range—You can choose which time range you want to analyze. Select the option you are interested in from the drop-down menu [A].
On the Dashboard, you’ll find general analytics for the selected Personal Shopping Inbox, including analytics for sent notifications. To check the statistics of a single notification, go to the Notification List and access Analytics from that level.
Read more about the notification list >>
2. Personal Shopping Inbox Analytics
The first group of statistics on the Personal Shopping Inbox Dashboard is the widget’s overall analytics.
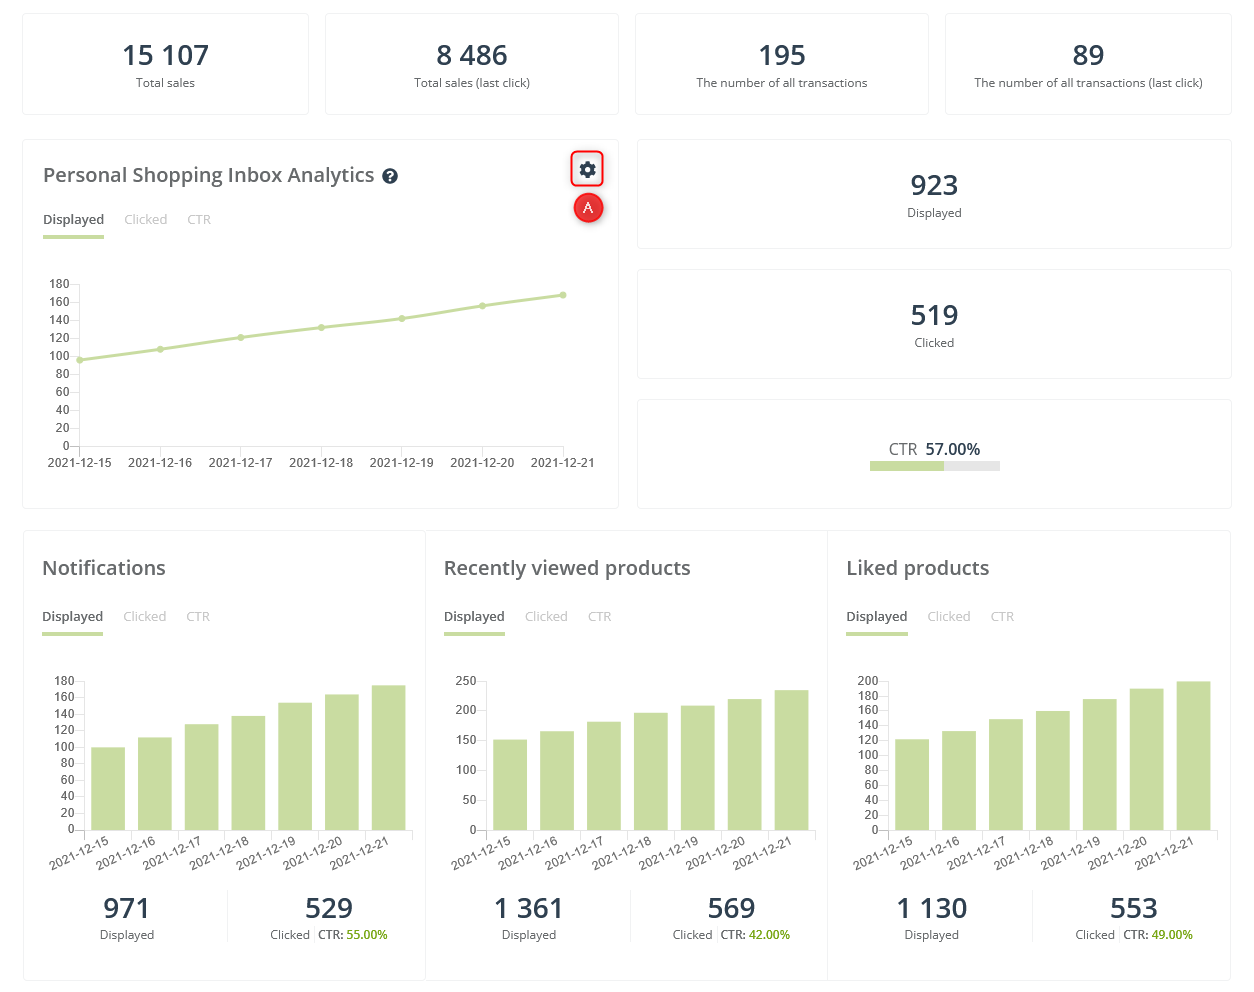
- Total sales—The total value of sales assisted in the Personal Shopping Inbox channel (overall);
- Total sales (last click)—The total value of sales assisted in the Personal Shopping Inbox channel (last click);
- Number of all transactions—The number of transactions assisted in the Personal Shopping Inbox channel (in general);
- Number of all transactions (last click)—The number of transactions assisted in the Personal Shopping Inbox channel (last click);
- Personal Shopping Inbox Analytics Chart—Visual representation of the analytics of the Personal Shopping Inbox broken down by selected indicators. On the chart, you can easily switch the view depending on the indicator you are interested in (Displayed, Clicked, CTR).
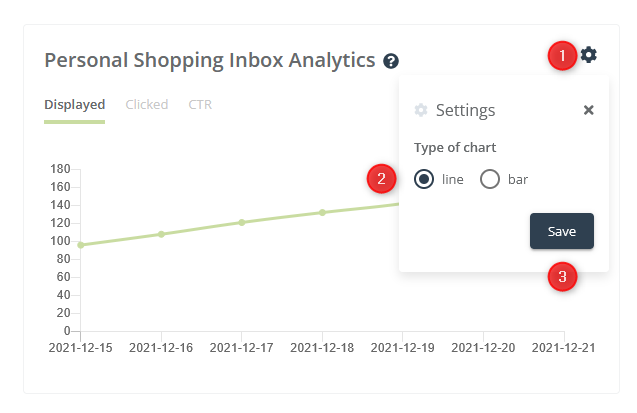
[1] Change chart type—You can also go into the chart settings and change the type [2] from line to bar or vice versa. To save the selected setting, click Save [3].
- Displayed—The number of times the Personal Shopping Inbox has been displayed;
- Clicked—The number of clicks on the Personal Shopping Inbox;
- CTR (Click-through Rate)—The click-through rate of the Personal Shopping Inbox.
CTR (Click-through Rate)—The click-through rate of the Personal Shopping Inbox.
Group of charts for each Personal Shopping Inbox tab
In the same section, below the main statistics, you will find three charts showing statistics about each widget tab.
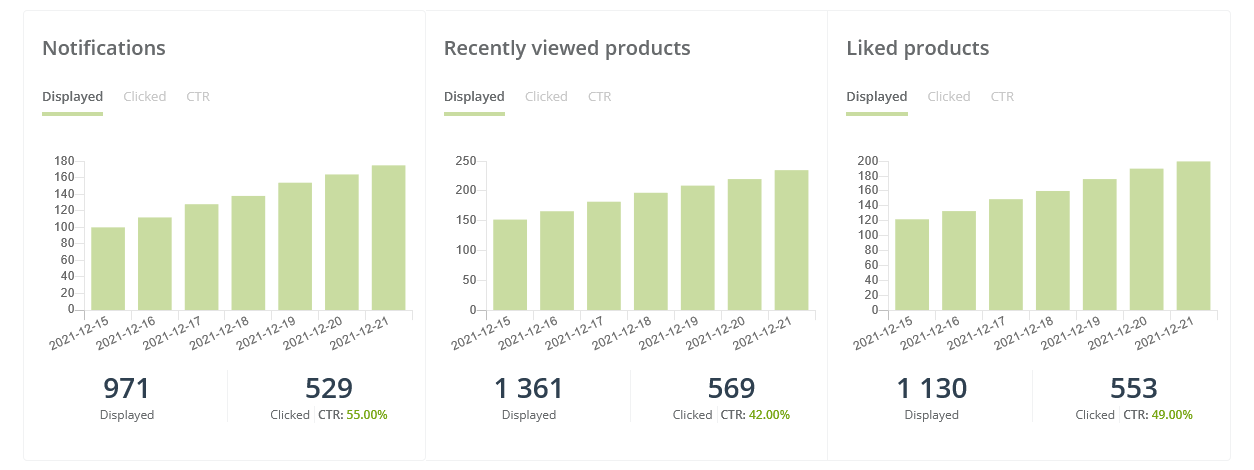
- Notifications Chart—Visual representation of the analytics of the Displays, Clicks, and CTR of the Notifications tab in the analyzed Personal Shopping Inbox. On the chart, you can smoothly switch the view to analyze the performance indicator you are interested in (Displayed, Clicked, CTR). Additionally, under the chart you will find numbers corresponding to total impressions, total clicks, and average CTR in the analyzed timespan.
- Recently Viewed Products Chart—Visual representation of the analytics of the Displays, Clicks, and CTR of the Recently viewed products tab in the analyzed Personal Shopping Inbox. On the chart, you can smoothly switch the view to analyze the performance indicator you are interested in (Displayed, Clicked, CTR). Additionally, under the chart you will find numbers corresponding to total impressions, total clicks, and average CTR in the analyzed timespan.
- Liked Products Chart—Visual representation of the analytics of the Displays, Clicks, and CTR of the Liked Products tab in the analyzed Personal Shopping Inbox. On the chart, you can smoothly switch the view to analyze the performance indicator you are interested in (Displayed, Clicked, CTR). Additionally, under the chart you will find numbers corresponding to total impressions, total clicks, and average CTR in the analyzed timespan.
ATTENTION: The display of each data set will depend on what tabs you set in this particular Personal Shopping Inbox.
EXAMPLE: In your Personal Shopping Inbox, you have set only tabs with notifications and liked products. In analytics, you will see data related only to those tabs.
3. Notification Analytics
In Notification Analytics, you will find data about notifications sent within the analyzed Personal Shopping Inbox.
ATTENTION: You will only see notification data if you choose to display notifications in your Personal Shopping Inbox.
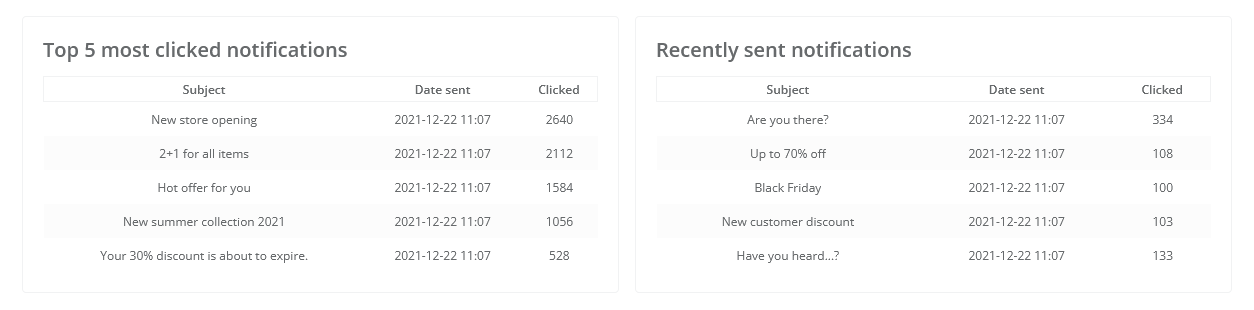
- Top 5 most clicked notifications—A list of the 5 most clicked notifications. On the list, you will find the notification subject, sending date, and number of clicks.
- Recently sent notifications—A list of recently sent notifications. On the list, you will find the notification subject, sending date, and number of clicks.
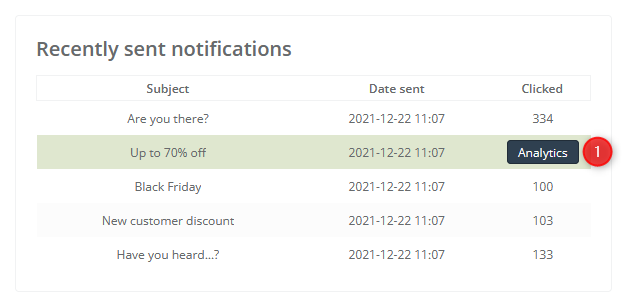
In both charts, when you hover over a notification name, you can access its analytics by clicking the Analytics button [1].
Read more about Notification List and single notification analytics >>
4. Product Analytics
The last group of statistics on the Dashboard is the list of displayed products (recently viewed and liked) within the analyzed Personal Shopping Inbox.
ATTENTION: You will only see notification data if you choose to display Recently viewed and Liked products in your Personal Shopping Inbox.

[1] Tabs—On the list, you will find statistics for two groups of products: recently viewed and liked. To see statistics for a selected group click on the appropriate tab.
[2] List—On the list, you will find the top 5 products from selected groups (recently viewed and liked). Each item contains the following information:
- Product—An image representing a product, pulled automatically from the product feed (XML file);
- Personal Shopping Inbox—Name of the analyzed Personal Shopping Inbox;
- Displayed—The number of product displays within the analyzed timeframe;
- Clicked—The number of clicks on the product within the analyzed timeframe;
- CTR—The click-through rate of the product within the analyzed timeframe.
[3] E-shop—Name of the E-shop connected to the analyzed Personal Shopping Inbox.