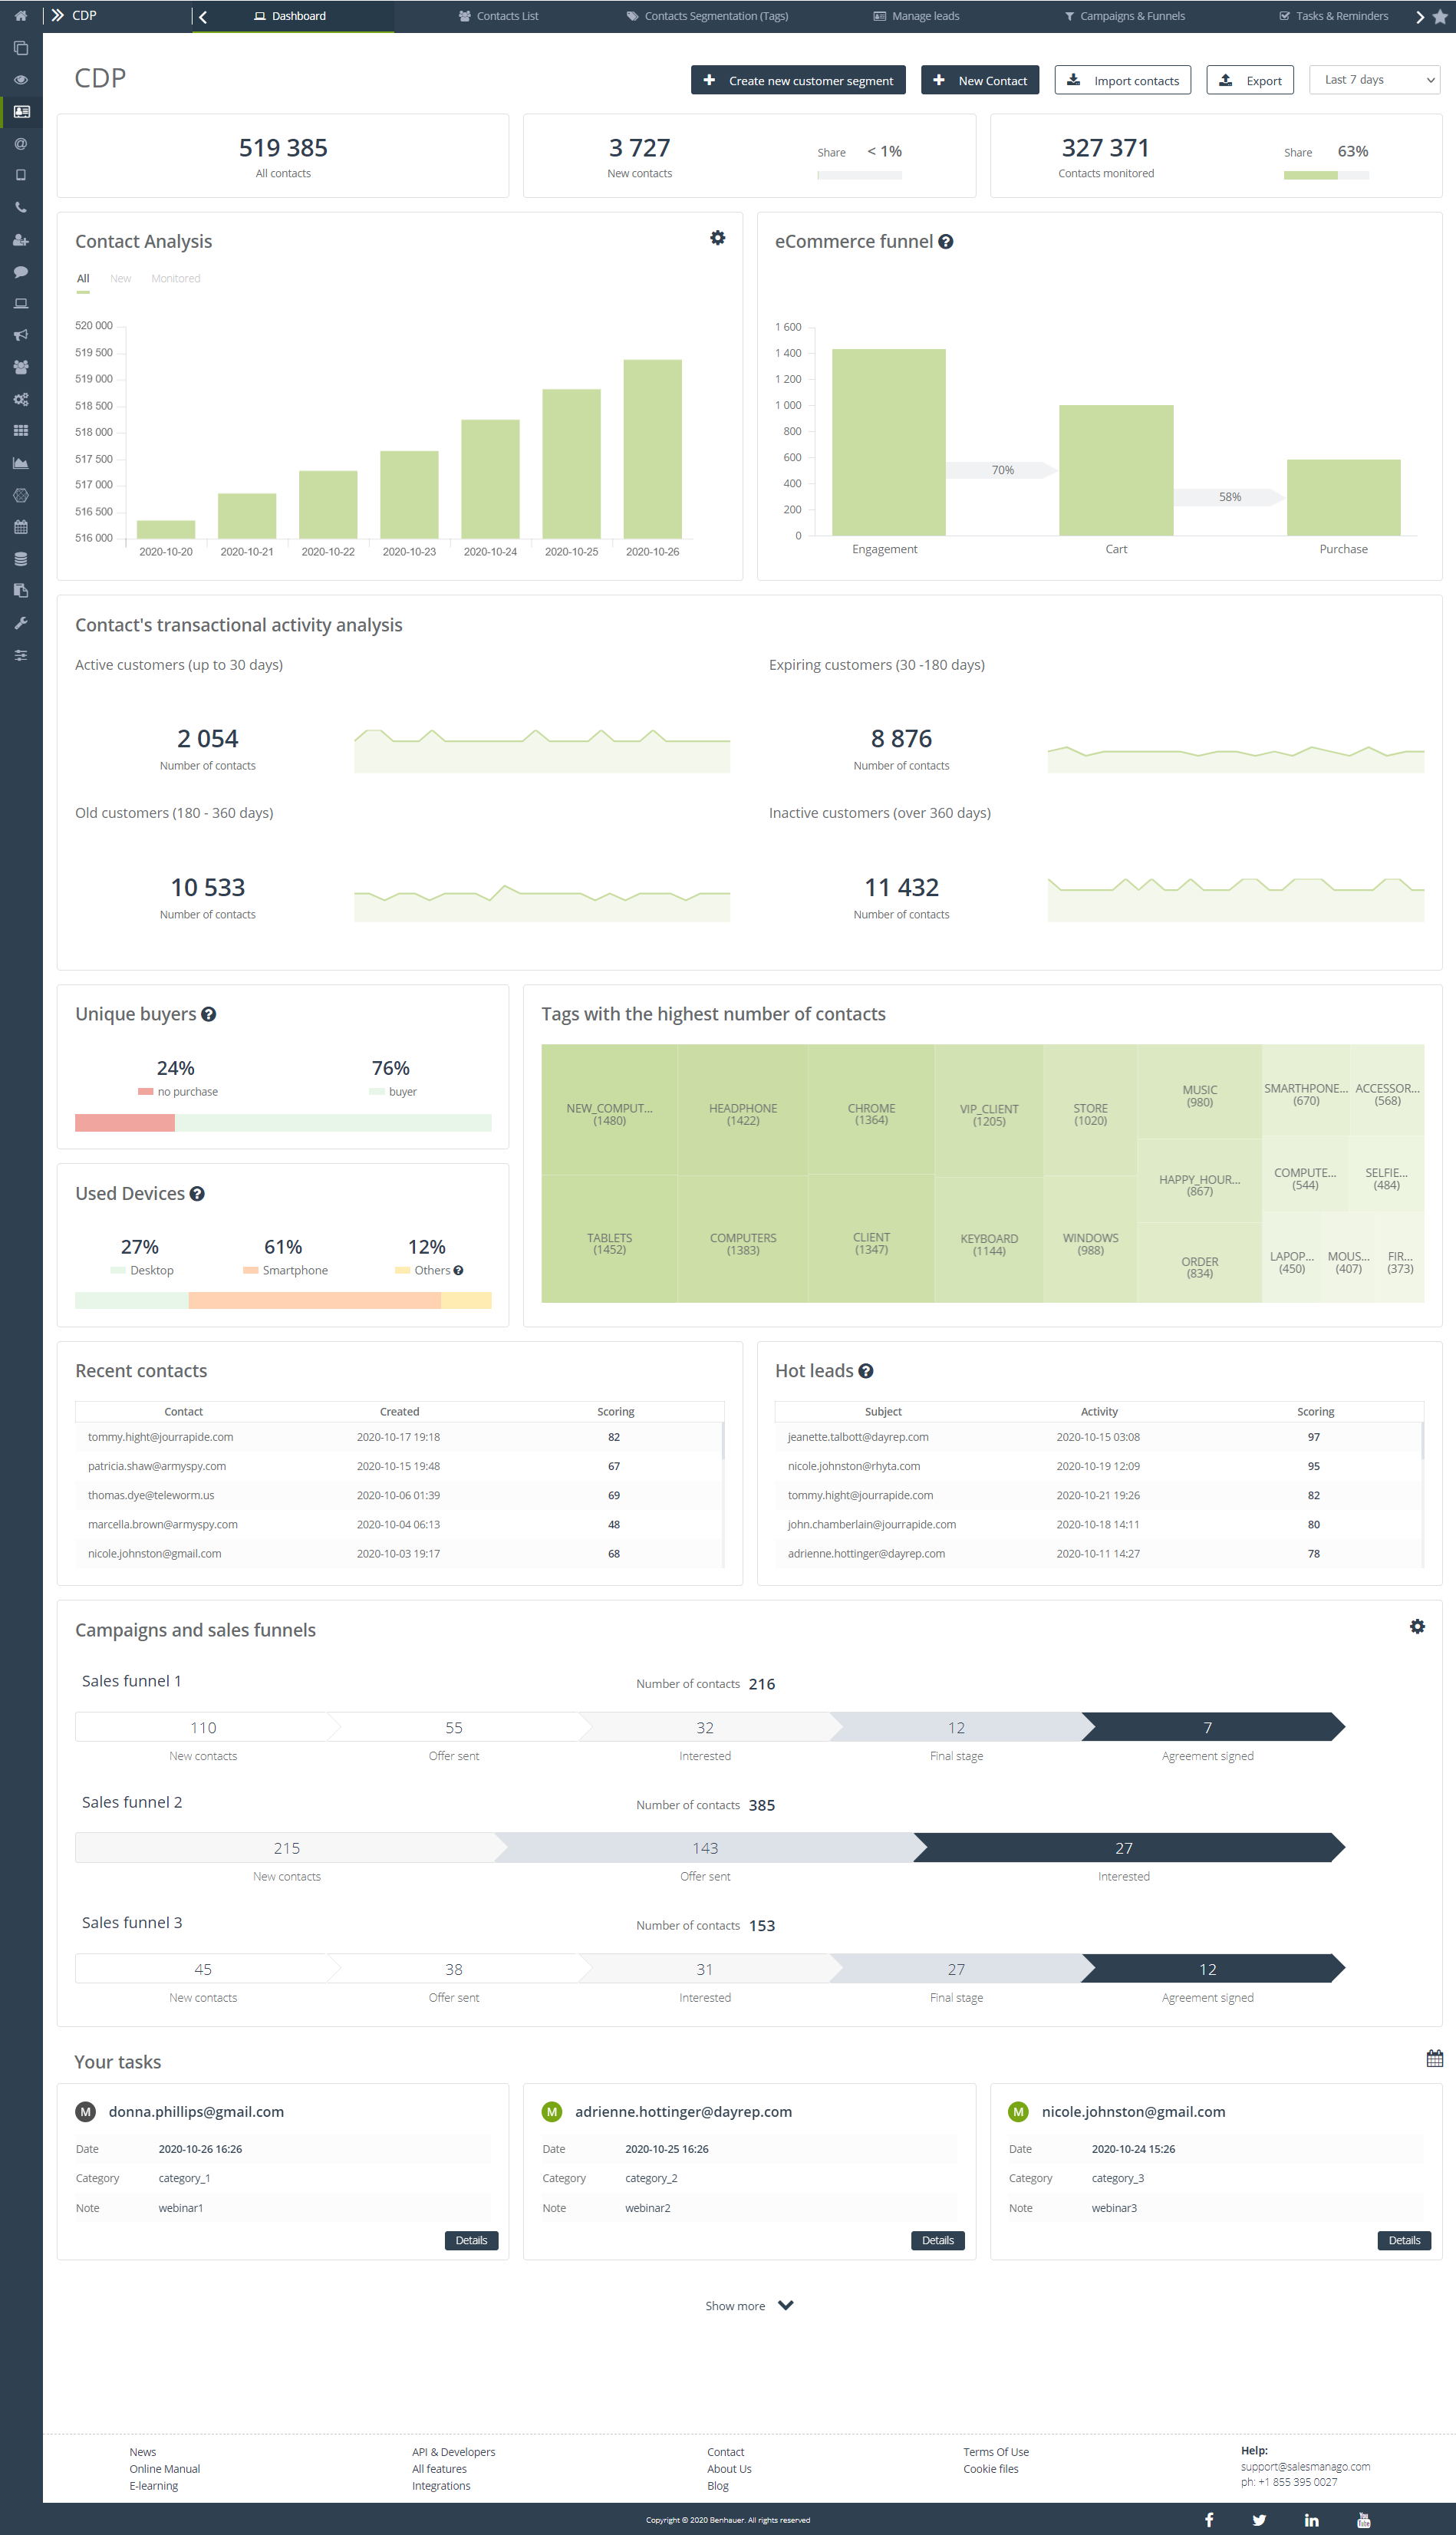
CDP Dashboard is an analytical panel that allows for an in-depth analysis of the contact database, segmentation, and conversion funnels. Use the data from the eCommerce funnel to view your contacts’ current transactional activity and assess their sales potential, or monitor the progress of your leads transfers between different stages in sales funnels. These and many other features will allow you to compare how your contact base is changing over time and analyze how you can improve your new lead acquisition strategy.
To open CDP Dashboard, go to
Audiences → Contacts → Dashboard
Contents
- Basic information
- Contact Analysis
- eCommerce funnel
- Contact’s transactional activity analysis
- Unique buyers
- Used devices
- Tags with the highest number of contacts
- Recent contacts
- Hot leads
- Campaigns and sales funnels
- Your tasks
1. Basic information
On the CDP Dashboard you will find basic statistics and information about your contact database:
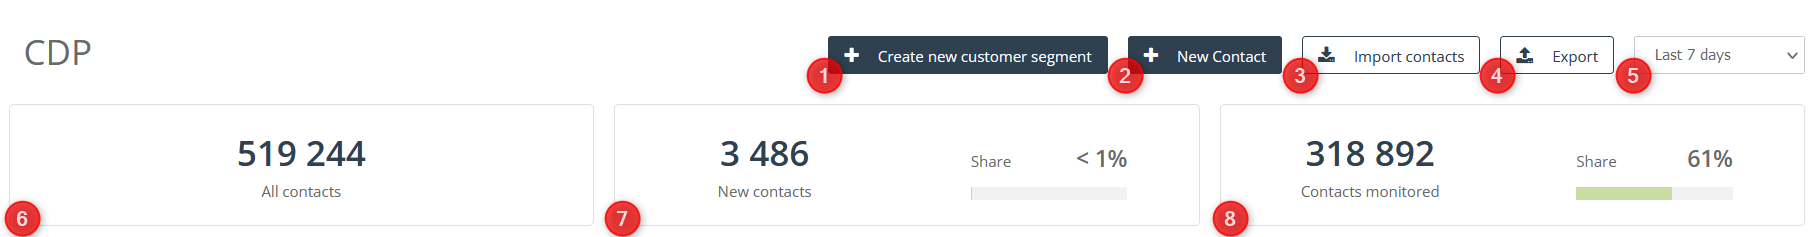
[1] + Create new customer segment – click the button to create a new customer segment after redirecting to the Customer Segmentation Center.
[2] + New Contact – click the button to manually add a new contact to your database.
[3] Import contacts – click the button to go to the contacts import panel.
More information about this you can find here >>
[4] Export – click the button to export basic statistics to a chosen folder.
[5] Time period – select the time period for which there will be displayed information in the tiles below – the available options are last 7 days, 30 days, current month, previous month, current quarter, previous quarter, current year, previous year, last 12 months.
[6] All contacts – the tile shows the total number of contacts in your database.
[7] New contacts – the tile shows the number of contacts that joined your database in the time period selected in point [5]. The share means the percentage of new contacts in relation to your base total.
[8] Contacts monitored – the full definition and rules of monitoring contacts can be found here in the post Contact monitoring – the principles of operation and the scope of collected data. The given value relates to the time interval selected in point [5]. The share means the percentage of monitored contacts in relation to your base total.
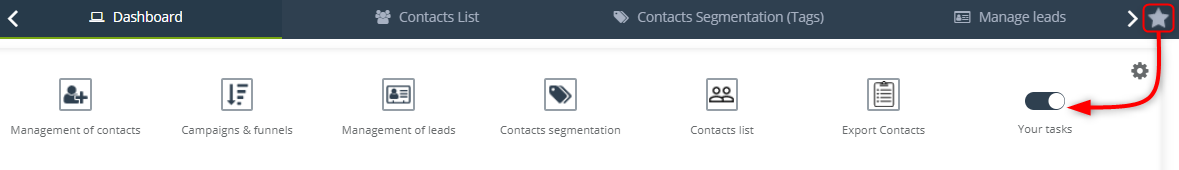
IMPORTANT: There is a star icon in the top menu on the tab bar at the very top of the page. This is a link that will direct you to quick links:
-
- Management of contacts,
- Campaigns & funnels,
- Management of leads,
- Contacts segmentation,
- Contacts list,
- Export Contacts,
In addition, from this place you can turn off Your tasks on the Dashboard:
2. Contact Analysis
In Contact Analysis appear graphically presented information on the number of all contacts, new contacts, and the contacts monitored. The given values refer to the previously selected time period.
We can choose the type of graph presenting analytical data by clicking on the window settings icon – we can choose between the options of line and bar graphs.
3. eCommerce funnel
The eCommerce funnel tile shows Engagement, which is the total number of contacts’ interactions with activities carried out with SALESmanago, which translates into carts and further purchases of unmonitored and monitored users on the website. Another value on it is the percentage of carts from the total number of visits [1], i.e. the percentage of interactions completed with adding the product to the planned purchases, and the percentage of purchases from carts [2], i.e. the actual number of visits that have been completed by finalizing the purchase.

4. Contact’s transactional activity analysis
Contact’s transactional activity analysis allows you to show the division of users buying products on your website according to the time since their last purchase.
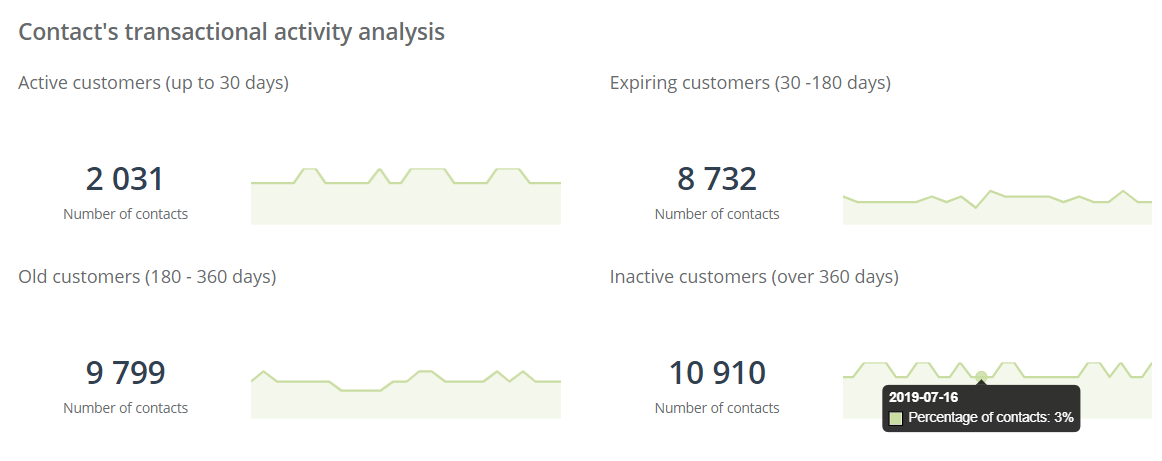
We distinguish:
- Active customers – the time from the last purchase is less than 30 days.
- Expiring customers – the time since the last purchase is 30 to 180 days.
- Old customers – the time from the last purchase is from 180 – 360 days.
- Inactive customers – the time from the last purchase is over 360 days.
All these values are presented on the chart, when you hover the mouse over the selected element, you can get information about the percentage of your entire contact database that a given group of customers was on the selected day.
5. Unique buyers
The data in the tile shows the percentage of the total number of recent visits by users of your database that ended with purchase, and the ones that did not.
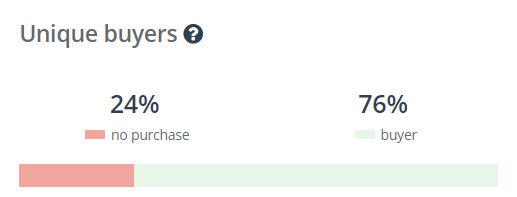
IMPORTANT: The last source of the visit is taken into account and the data is calculated once a day.
6. Used Devices
The tile shows what percentage of visits to your website took place from the selected device. The last source of the website visit is taken into account.
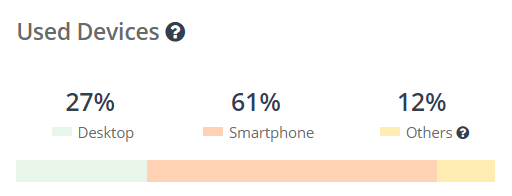
In this case, Others are devices that the system was unable to classify as desktop devices or as smartphones.
IMPORTANT: The above data is calculated once a day.
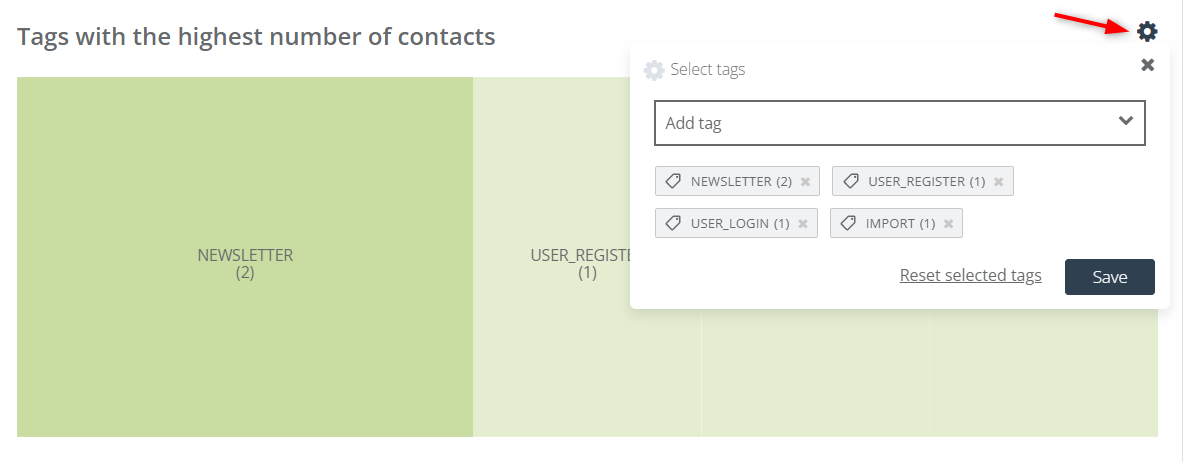
7. Tags with the highest number of contacts
Another element of the CDP Dashboard is a graphically presented list of the tags most often owned by contacts. The darker the color of the field, the more users have the tag.
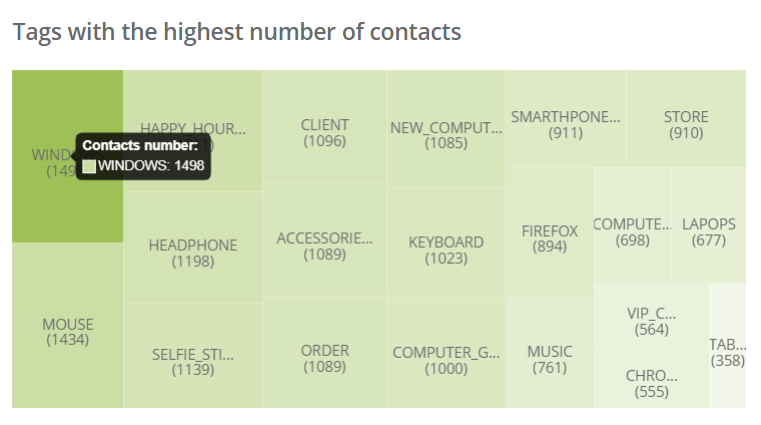
IMPORTANT: Clicking on the selected element of the tile with the name of the tag will redirect you to the list of contacts who have it.
You can also define which tags should be displayed on the Dashboard. Click the Gear icon to expand the selection box, then add or remove tags as needed.
8. Recent contacts
Recent contacts is a list of emails from users who have just joined your database, along with the date and exact time they were added, and the scoring that was assigned to them.

You can go to the selected user’s contact card at any time by clicking the Details button.
9. Hot leads
Hot leads tile is a list of contacts that have recently shown activity, have high scoring, and the status of a potential customer.
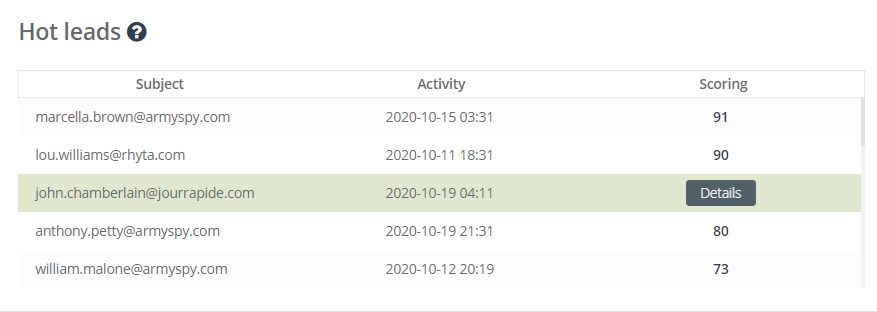
You can go to the selected user’s contact card at any time by clicking the Details button.
10. Campaigns and sales funnels
Here you can see your most popular sales funnels, the number of contacts at a given stage of the funnel, and its percentage of total contacts in a given funnel.
By clicking the settings icon, you can select the campaigns you want to be presented graphically on the Dashboard.
11. Your tasks
This tile shows the list of tasks to be performed by the logged-in user for a given contact.
Click the Details button to go to detailed information about the task.
You can also use the calendar as a filter by clicking its icon to shorten the list of tasks to those you have to do on the selected date.