Useful links
Combine the Customer Data Platform’s various built-in tools to collect information about your customers in the Customer Preference Center. Use that information to get to know your audience even better. Analyze the data on a convenient Dashboard to discover trends in customer preferences and optimize your activities.

To open the Customer Preference Center Dashboard, go to
Audiences → Preference Center → Dashboard
Contents
- Basic information
- Preference Center analytics
- Preference analytics
- Suggested recommendations for individual Contacts
1. Basic information
The Customer Preference Center Dashboard is a comprehensive analytical panel that provides a convenient graphic visualization of this tool’s performance indicators. The Dashboard offers the analytics of the Center itself, the analytics of particular preference types, and suggested recommendations for individual Contacts. Conveniently, you can also access the Preference Center Wizard or edit an active Center directly from the Dashboard.
Learn how to use the Customer Preference Center Wizard >>
Read more about the data types collected in the Customer Preference Center >>
Learn how you can apply data collected in the Customer Preference Center >>
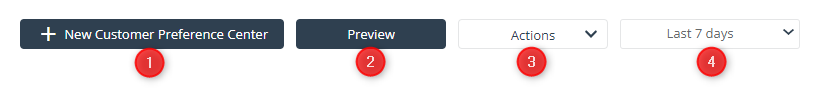
At the Dashboard level, you can:
- Create a new Center.
- Preview a selected Center.
- Perform the following Actions on an active Center:
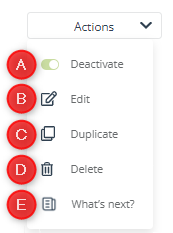
- Deactivate the Center,
- Edit the Center,
- Duplicate the Center,
- Delete the Center,
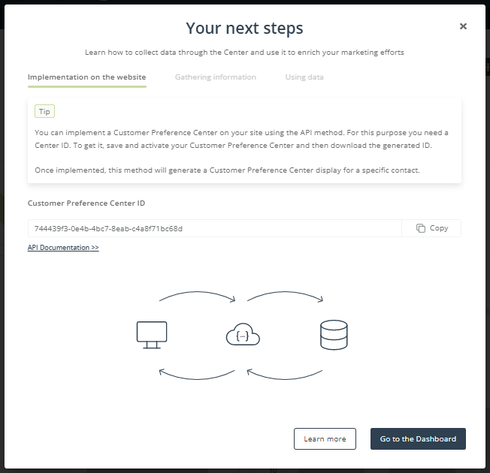
- Open the Your next steps pop-up:
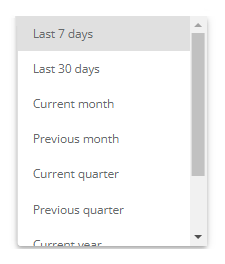
4. Change the analytics time range – by selecting a specific time range from the options in the drop-down menu:
2. Preference Center analytics
To display the statistics for a specific Center, click on its name [1]. The first group of statistics available on the Dashboard represents the analytics of the individual Center.
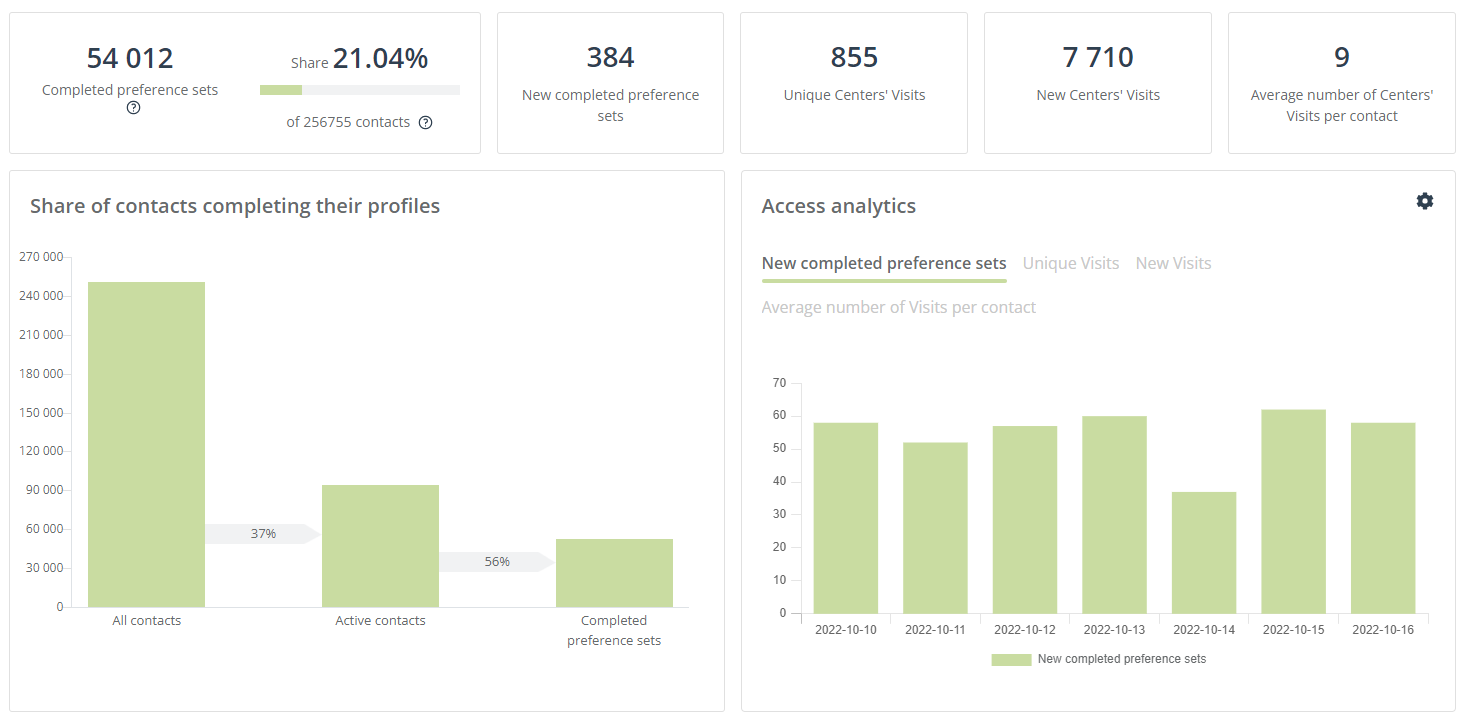
- Completed preference sets – the number of completed sets. A preference set refers to any information on a Contact provided through the Customer Preference Center.
- Percentage share – indicates the percentage of your Contacts who have completed a preference set in the Customer Preference Center.
- New completed preference sets – the number of new preference sets completed within the selected time period.
- Unique Center visits – the number of first-time visits to the Center.
- New Center visits – the number of visits to the Center (how many times the Center is opened) within the selected time period.
- Average number of Center visits per Contact – the total number of visits to the Center divided by the total number of Contacts.
- Share of Contacts completing their profiles – a visual representation of the proportion of your Contact base that uses the Center and completes preference sets.
- Access analytics – a visual representation of selected statistics on a timeline. Switch between the bars to see different statistics.
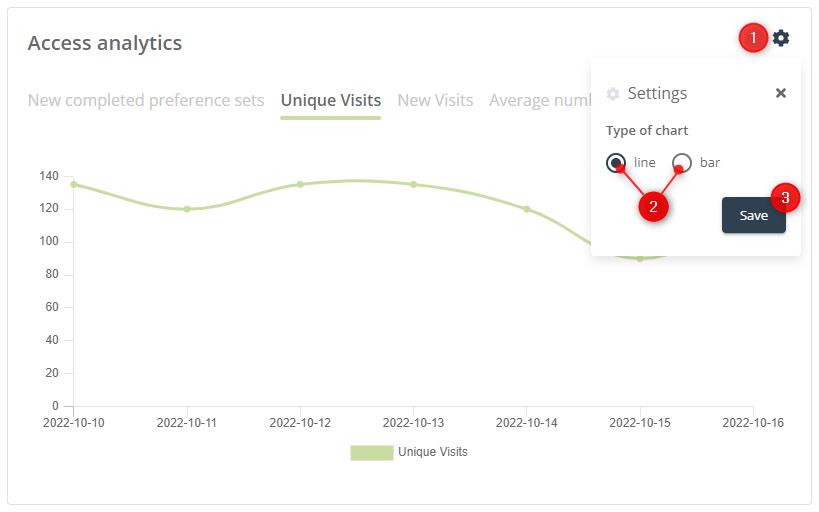
[1] Change chart type – click on the settings icon [1] to switch between the line and bar chart types [2]. To save the selected setting, click Save [3].
3. Preference analytics
The preference analytics provides information on the number of declarations in specific preference categories. See how many Contacts have indicated particular channels, frequencies, days, and hours as preferred.
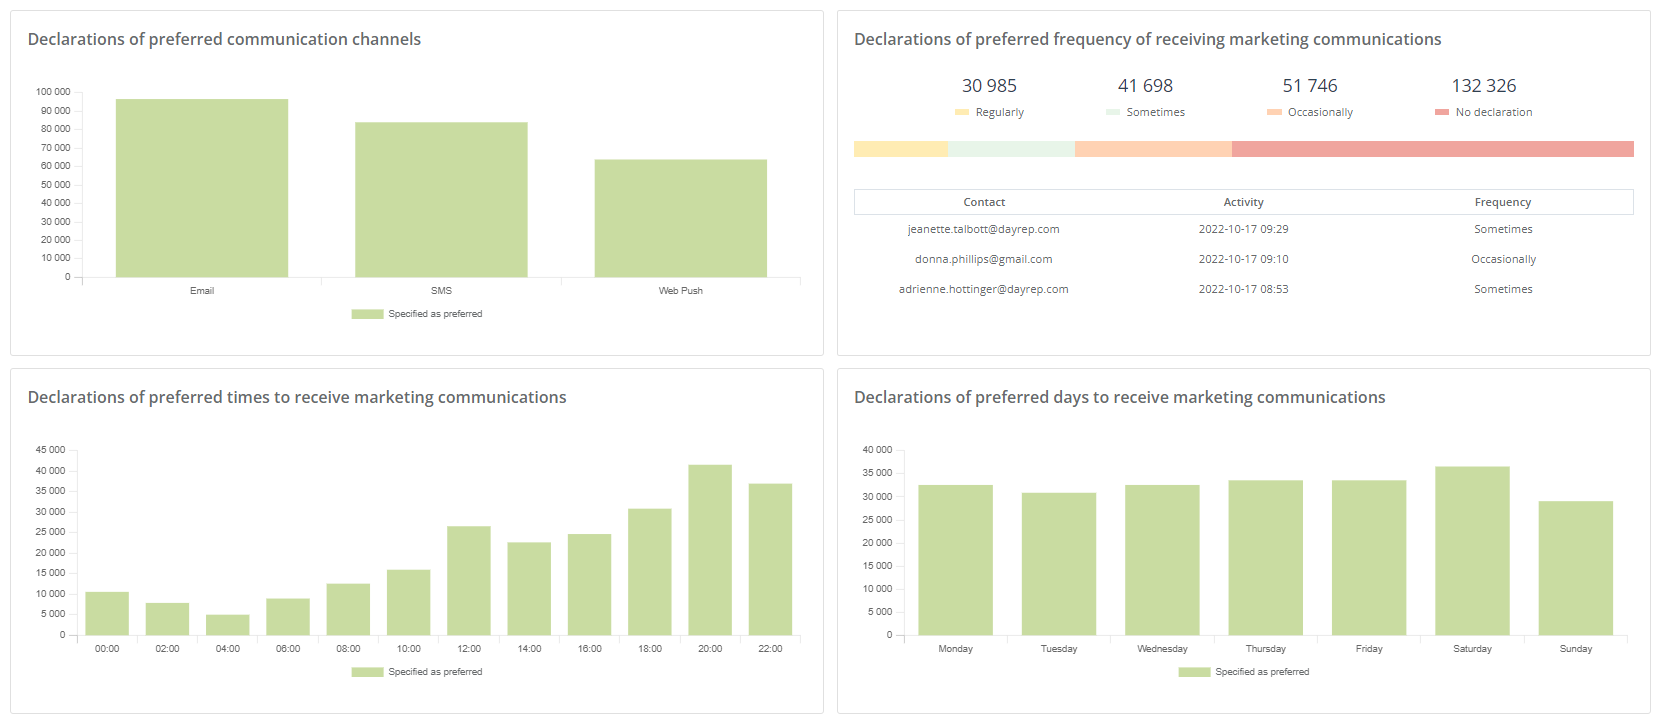
- Declarations of preferred communication channels – a visual representation of how many times each channel has been indicated as preferred.
- Declarations of preferred frequency of receiving marketing communications – a visual representation of how many times each frequency has been indicated by Contacts as preferred.
- Declarations of preferred times to receive marketing communications – a visual representation of how many times specific hours have been indicated by Contacts as the preferred time for receiving communications.
- Declarations of preferred days to receive marketing communications – a visual representation of how many times specific days of the week have been indicated by Contacts as preferred days for receiving communications.
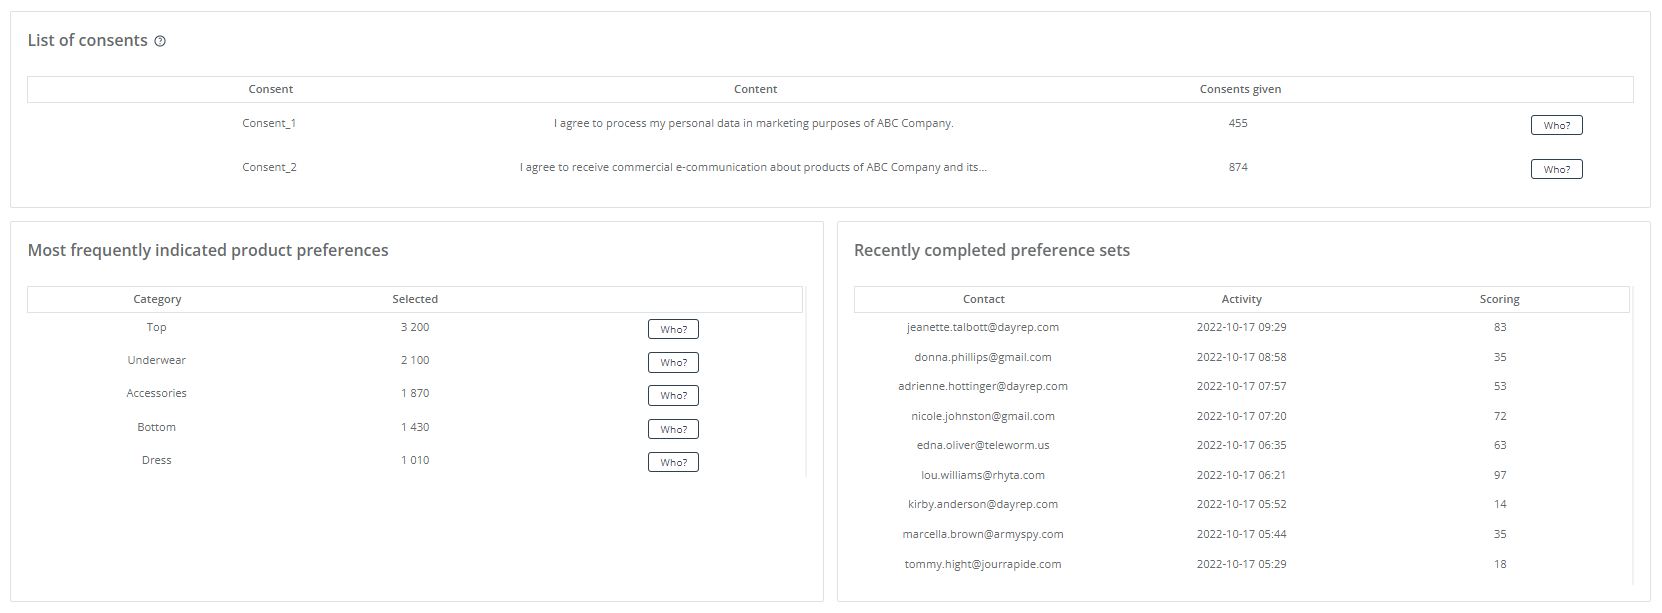
- List of consents – statistics on the opt-in and marketing consents shown in the selected Preference Center.
- Most frequently indicated product preferences – a list of preferences that are most frequently indicated by users in the product preference section.
- Recently completed preference sets – a list of Contacts who have recently completed preference sets in the Preference Center.
4. Suggested recommendations for individual Contacts
The recommendation suggestions comprise a product set from your store that is individually tailored for each Contact based on the product preferences they have indicated.
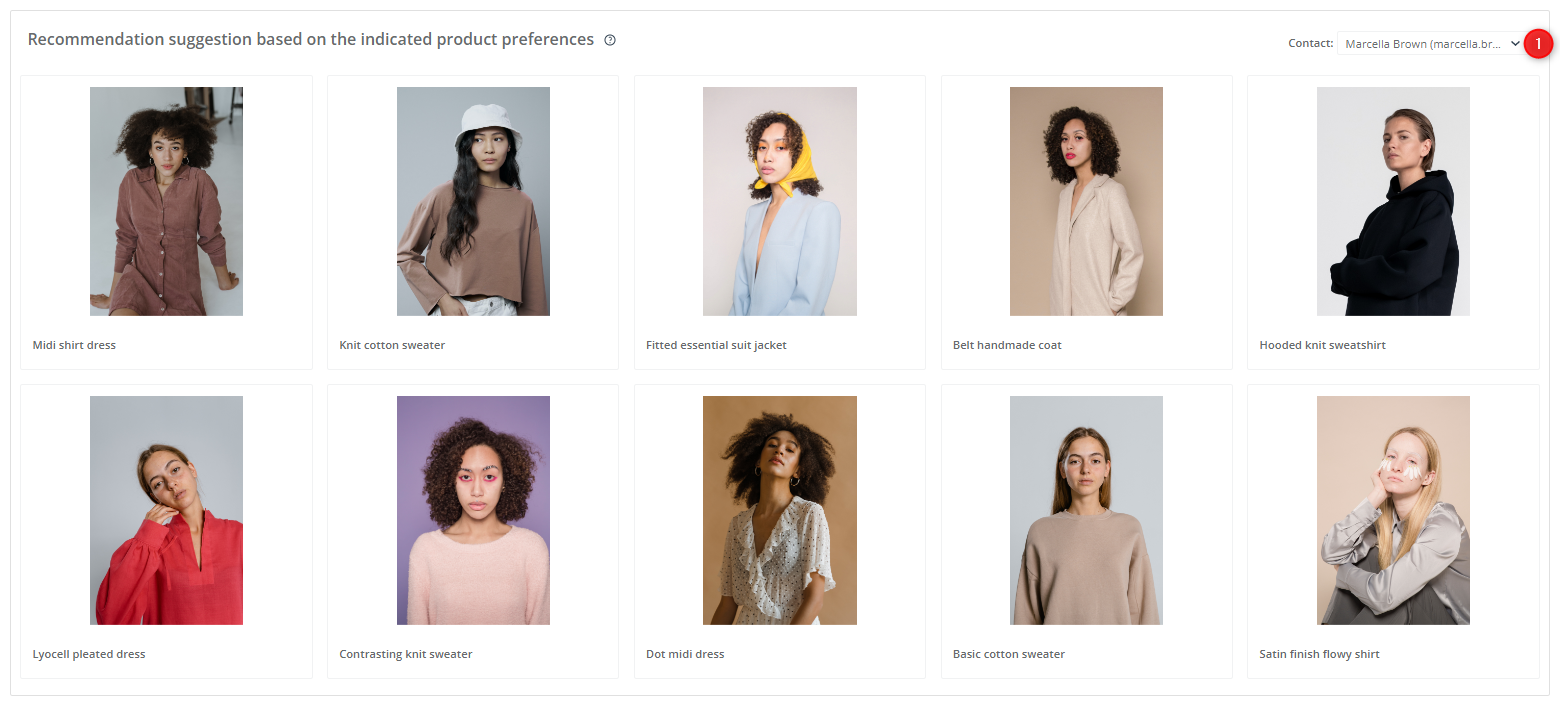
For recommendation suggestions to be generated, product preferences must be collected in the Customer Preference Center. The system uses these preferences to calculate the product recommendations that best match the interests of individual Contacts. You can use such data in recommendation frames, emails with recommendations, and Web Push notifications.
The suggestions are selected individually for each Contact. To see a specific set, find the email address of that Contact in the drop-down list [1].