Useful links
Monthly reports take the form of a summary of your activities on the SALESmanago platform. Thanks to their clarity you can quickly verify the results that you achieve within given module in the system. They are readable and comfortable as they comprise of all necessary information at hand, so you don’t have to log in to the system to generate such report. They usually appear on the first day of the month.
Benefits:
- the possibility of weighing such a report against other monthly reports and analyzing the results in order to increase the effectiveness of marketing activities
- no need to log in to the system to generate such report, they are sent directly to the inbox
- includes a proposition of modules which you haven’t used yet
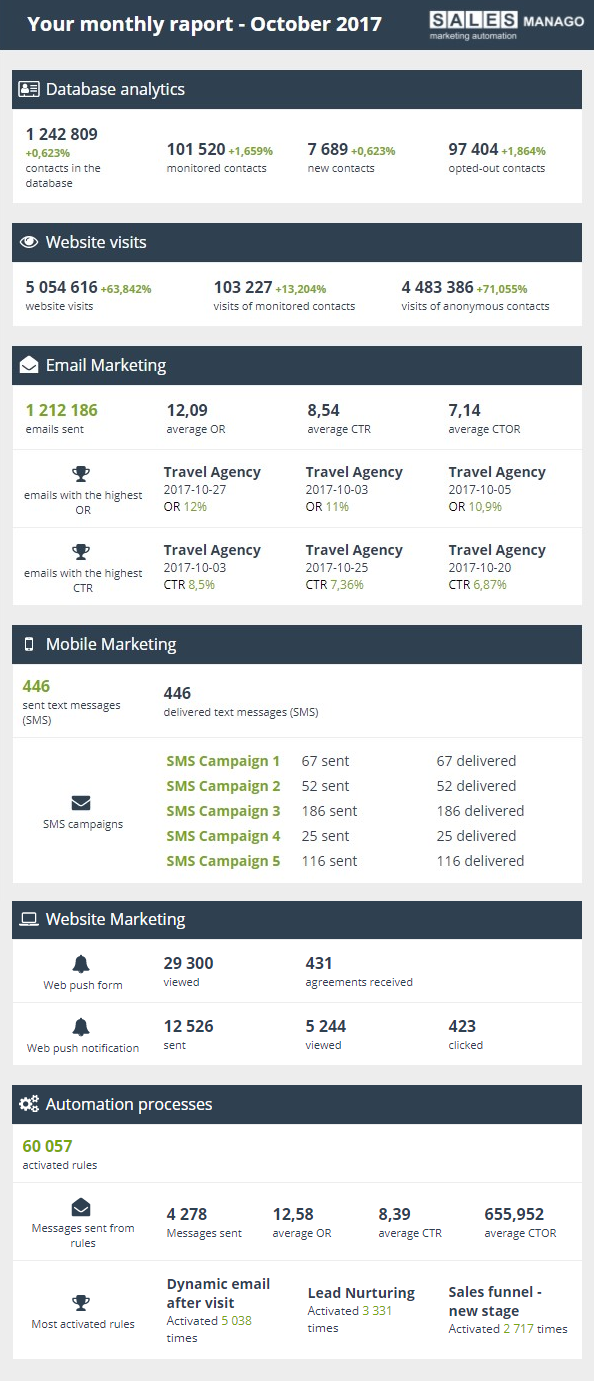
Below you can find an exemplary report generated by a travel agency.
To generate such report you need to:
Go to Insights → Reports
After you go to Reporting tab, you need to adjust the following settings:
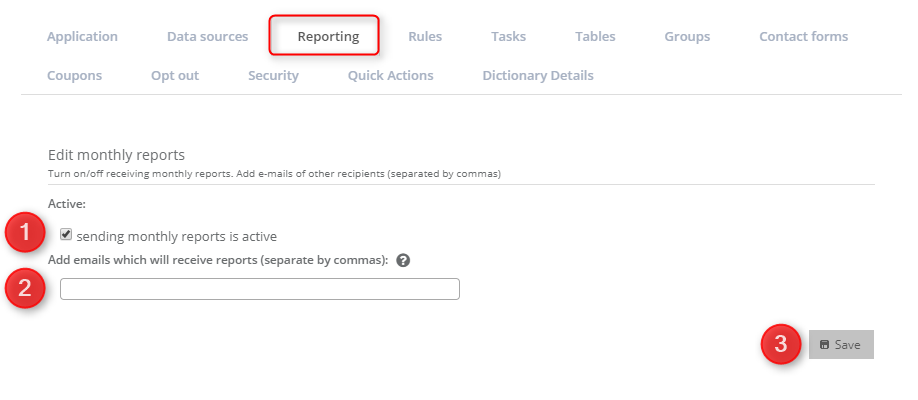
[1] Active: sending monthly reports is active – after you tick this checkbox, you will receive a report on the main email address every month.
[2] Add emails which will receive reports – apart from sending a report to the default email address, you can type in the email addresses that you need to separate with commas.
[3] Save – once you’re done, click the button.
A report is divided into sections. In the beginning, there are two standard sections: Database analytics and Website visits. It is a summary of the increase of the new contacts in the database. Moreover, this section depicts the general number of the contacts in the system. Apart from that, the report shows the statistics on the website visits by both anonymous and monitored contacts.
Below you can find modules that the company makes use of. The first of them is Email marketing in which you can find three subsections: email statistics (sent emails, average open rate, average click rate and click to open rate), emails that received the highest open rate and emails that received the highest click rate. You can find there also additional information about the date of such mailing and specified rates for each email.
Then, you can find the details about Mobile Marketing module that contains information about SMS campaigns which were implemented in the given month, how many messages have been sent and delivered.
In Website Marketing section you can find information about the number of the viewed Web Push forms and how many agreements the company received in the given month. And also, you can see how many Web Push notifications have been sent, how many of them were viewed or clicked.
The last section contains the information about Automation Processes and how many rules have been activated. You can find the analysis of the messages that have been sent from the rule and its open rate as well as click through rate and click to open rate. In the last subsection, you can find names of the three most activated rules and information about how many times they were activated. Additionally, in this section you can find detailed statistics on Workflow processes and analytics of dynamic emails and emails with abandoned cart.
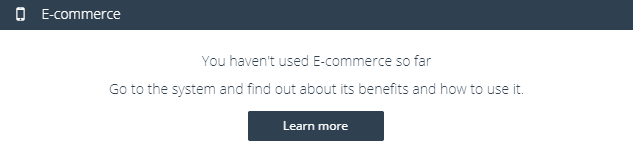
At the bottom of each report, you can find a section about a module that you don’t use. By clicking Learn more you will be redirected to the system where you can obtain detailed information about how you can use such module and what effects you can achieve.
Submit your review | |