Web Push notifications are an important part of many marketing strategies. Consisting of an icon and short text message, they are a quick and effective way to communicate with your contacts. Web Push notifications analytics allows you to keep track of the effectiveness of your marketing activities in this channel and to optimize them, if necessary.
To open the Web Push Notification Dashboard, go to
Web Push → Dashboard
Contents
- Basic information
- Web Push notification analytics
- Sales analytics
- Consent form analytics
1. Basic information
The Web Push Notification Dashboard is a comprehensive analytics dashboard that gives you an easy-to-use, graphical view of the performance metrics in this channel. On the Dashboard, you’ll find analytics for notifications themselves, sales analytics, and analytics for consent forms. For extra convenience, you can also easily access the Notification Wizard and Consent Form Wizard from the Dashboard.
Learn how to use the Web Push notification wizard >>
Learn how to use the Dynamic Web Push notification wizard >>
Learn how to use the consent form wizard >>
On the Dashboard, you’ll find general analytics for all notifications and all forms. To check the statistics of a single notification or form, go to the Notification List or Consent Form List, respectively, and access Analytics from that level.
Read more about the Web Push notification list >>
Read more about the consent form list >>
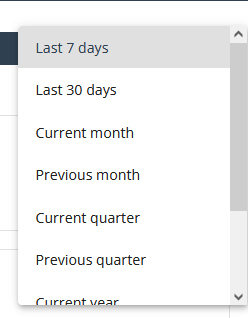
Analytics time range – You can select what time range you want to analyze. Select the option you are interested in from the drop-down menu.
2. Web Push notification analytics
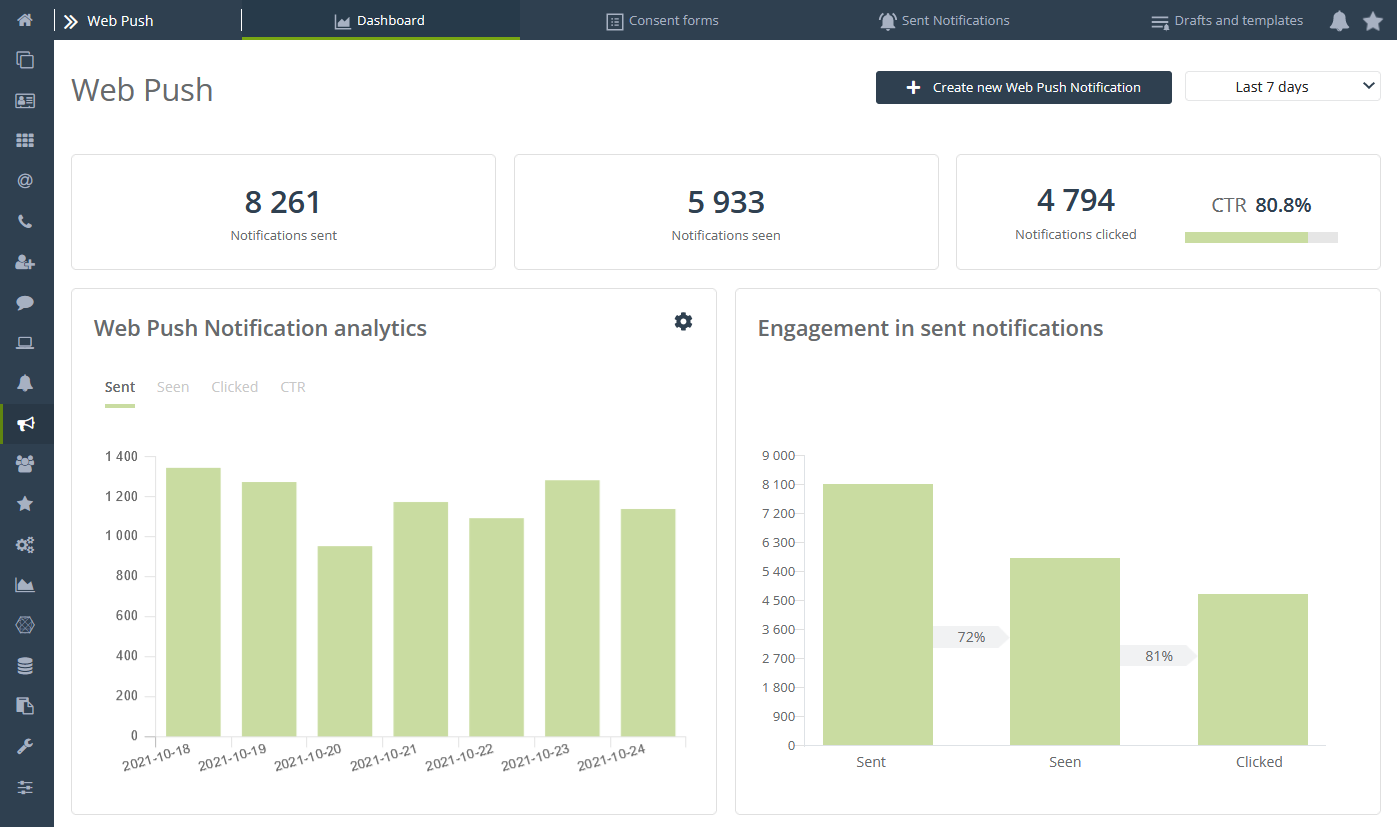
The first group of statistics on the Web Push Notification Dashboard is notification analytics.

- Notifications sent – The number of notifications sent.
- Notifications seen – The number of notifications displayed.
- Notifications clicked – The number of notifications clicked, along with the notification click-through rate (CTR).
- Web Push notification analytics chart – A graphical representation of notification analytics broken down by selected metrics. On the chart, you can easily switch the view depending on the effectiveness indicator you are interested in (Sent, Seen, Clicked, CTR).
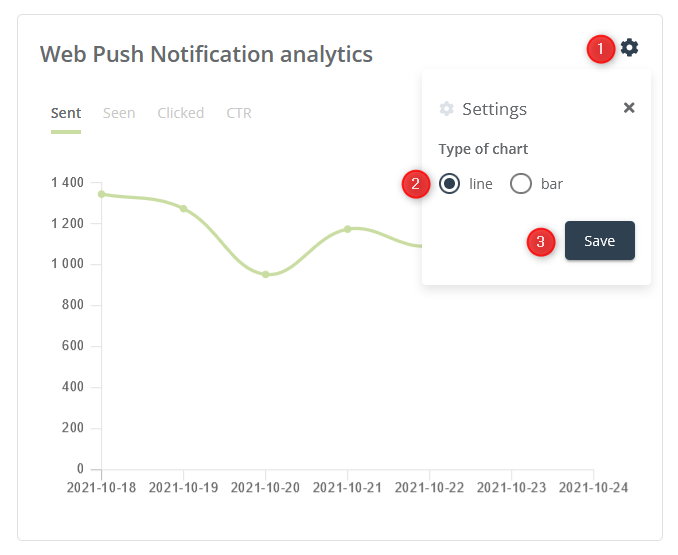
[1] Change chart type – You can also go into the chart settings and change the type [2] from line to bar or vice versa. To save the selected setting, click Save [3].
- Engagement in sent notifications graph – The graph shows the percentage ratio between the stages of notification engagement. You can check here what percentage of sent notifications were displayed and what percentage of displayed notifications were clicked.
3. Sales analytics
In sales analytics, you’ll find data on the impact of Web Push notifications on sales.

Total sales – The value of sales assisted in the Web Push channel (in general), followed by an indication of the share of this value in the total sales in the store.
Total sales (last click) – The value of sales assisted in the Web Push channel (last click), followed by an indication of the share of this value in the total sales in the store.
Number of transactions – Number of transactions assisted in the Web Push channel (in general), followed by an indication of the share of this value in the total sales in the store.
Number of transactions (last click) – Number of transactions supported in the Web Push channel (last click), followed by an indication of the share of this value in the total sales in the store.
4. Consent form analytics
The last group of statistics on the Web Push Notification Dashboard is consent form analytics. You can also quickly navigate to the Consent Form Wizard [1].
Learn how to use the consent form wizard >>
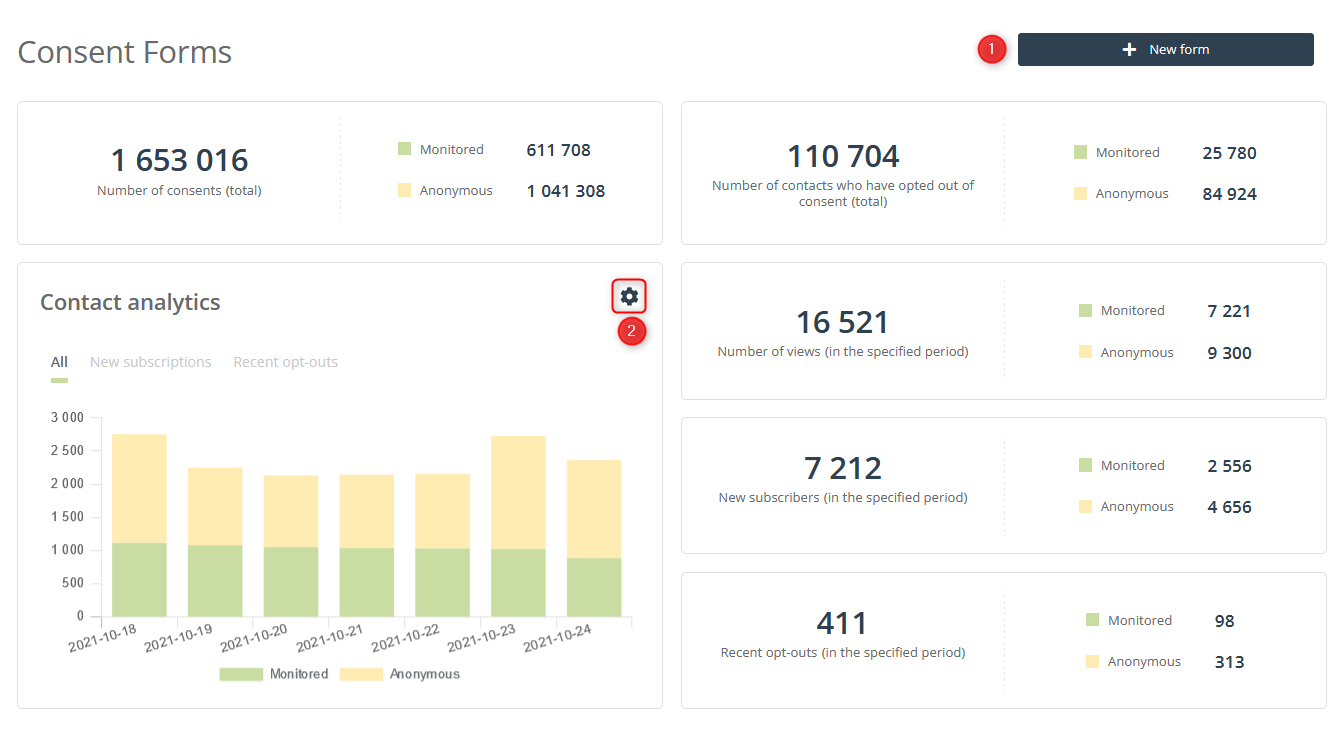
Number of consents (total) – The number of all consents broken down by monitored and anonymous contacts,
Number of contacts who have opted out of consent (total) – Number of all rejected consent forms, broken down into monitored and anonymous contacts.
Number of views (in the specified period) – Number of all the displays of consent forms in the analyzed period, broken down into monitored and anonymous contacts.
Newly subscribed (in the specified period) – Number of all contacts who gave their consent to receive Web Push notifications that appeared in the analyzed period, broken down into monitored and anonymous contacts.
Recent opt-outs (in the specified period) – The number of all contacts who withdrew their consent to receive Web Push notifications in the analyzed period, broken down into monitored and anonymous contacts.
Contact analytics chart – Visual representation of the analytics of consent forms, broken down by selected indicators. On the chart, you can easily switch the view depending on the indicator you are interested in (All, New Subscriptions, Recent Opt-outs).
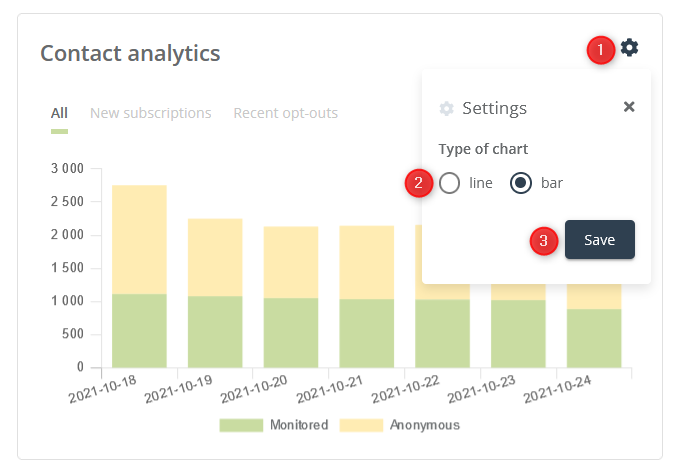
[1] Change chart type – You can also go into the chart settings and change the type [2] from line to bar or vice versa. To save the selected setting, click Save [3].